Data Analyst Roadmap: What to Learn First (2026 Guide)
Deciding what to learn first as an aspiring data analyst is confusing, not because the skills are unclear, but because the order is. Python, SQL, and statistics all matter. What matters more is knowing which one to focus on first, and for how long. That's what this roadmap lays out.
You'll get a clear, four-phase plan to become a job-ready data analyst in 2026, whether you're starting from zero or moving over from another field. No degree required, and no pretending it happens in a weekend.
At Dataquest, we've helped thousands of learners become job-ready analysts through our Data Analyst in Python Career Path, which follows this same foundation-first sequence with hands-on projects from day one.
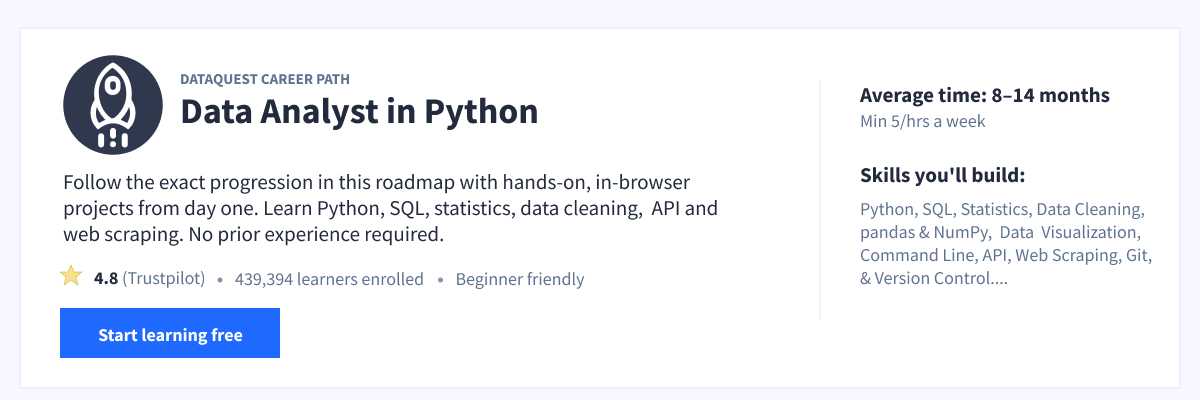
Table of Contents
- What's Changed About Becoming a Data Analyst in 2026
- Why Become a Data Analyst?
- What Does a Data Analyst Actually Do?
- How Long Does It Take to Become a Data Analyst?
- The Complete Data Analyst Roadmap
- Common Mistakes to Avoid
- Your Next Steps
- Frequently Asked Questions
What's Changed About Becoming a Data Analyst in 2026
The core skills of data analysis have been stable for years. But the environment you're entering has shifted, so it's worth setting expectations honestly before we get to the roadmap.
AI is changing the tasks, not erasing the role. Tools like ChatGPT and Microsoft 365 Copilot can now write a SQL query or generate a chart in seconds. That hasn't removed the need for analysts. It has raised the bar on the parts machines can't do well: asking the right business question, judging whether an answer makes sense, and explaining it to people who don't speak data.
The entry-level market is genuinely tougher, and not just in analytics. Recent graduates across many fields are facing a slower hiring rate, according to the Economic Policy Institute and New York Fed data on the college labor market. This is worth knowing so you can plan for a real job search, not a guaranteed one. A strong portfolio matters more than ever.
Employers want proof, not just a certificate. The single biggest advantage you can build is a small set of real projects that show you can take messy data and produce a clear answer. We'll build that into every phase.
This matches what practitioners are telling beginners who ask whether the path is still worth it. In a recent Reddit thread, one commenter summed up the 2026 reality:
"Data analyst isn't dead, but it's not 'easy money' anymore. In 2026 it's more skill-based than hype-based… Demand exists, but average profiles struggle. People with projects + clarity do fine." — r/dataanalysiscareers
The fundamentals still carry the job. SQL, data cleaning, and clear visualization still handle most of what analysts do day to day. Learn those well, and you'll be useful in your first week, regardless of which new tool appears next.
Why Become a Data Analyst?
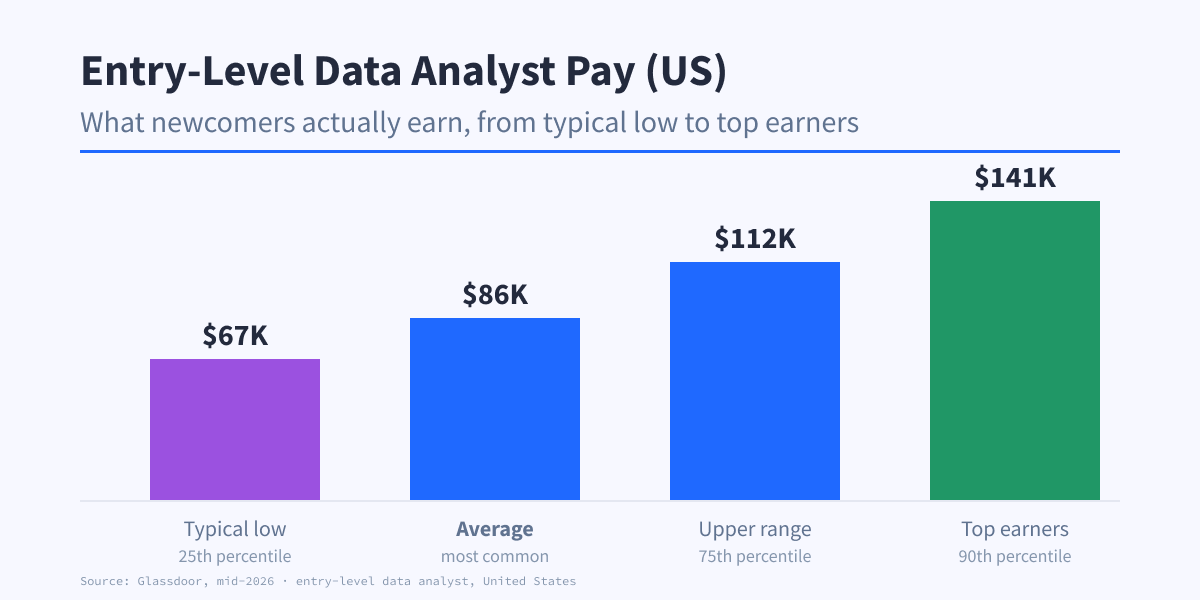
Before you invest months learning these skills, it helps to know why the destination is worth it.
- The pay is strong for an accessible entry point. Entry-level data analysts in the US earn an average of $85,700, with a typical range of $67,000 to $112,000, according to Glassdoor data from mid-2026. That's a healthy salary for a role you can reach without a graduate degree or years of prior coding.
- Demand is holding up well. The US Bureau of Labor Statistics doesn't track "data analyst" as its own category, but the closest occupations point the same direction: operations research analysts are projected to grow about 21% from 2024 to 2034, and data scientists about 34%, both far faster than the average job.
- Almost every industry hires analysts, and it's a launchpad. Finance, healthcare, retail, logistics, and government all run on data, so you can often analyze something you already care about. Data analysis is also the most common on-ramp to related careers, and data analytics jobs are in demand across the field. Once you're working with data daily, moving toward data science or a specialized analyst role becomes a natural next step.
What Does a Data Analyst Actually Do?
Data analyst job descriptions are full of intimidating language. The daily work is more approachable than the postings make it sound.
A Day in the Life of a Data Analyst
Picture a realistic Tuesday for an analyst at a mid-sized company, from an early Slack question to prepping the next day's meeting.
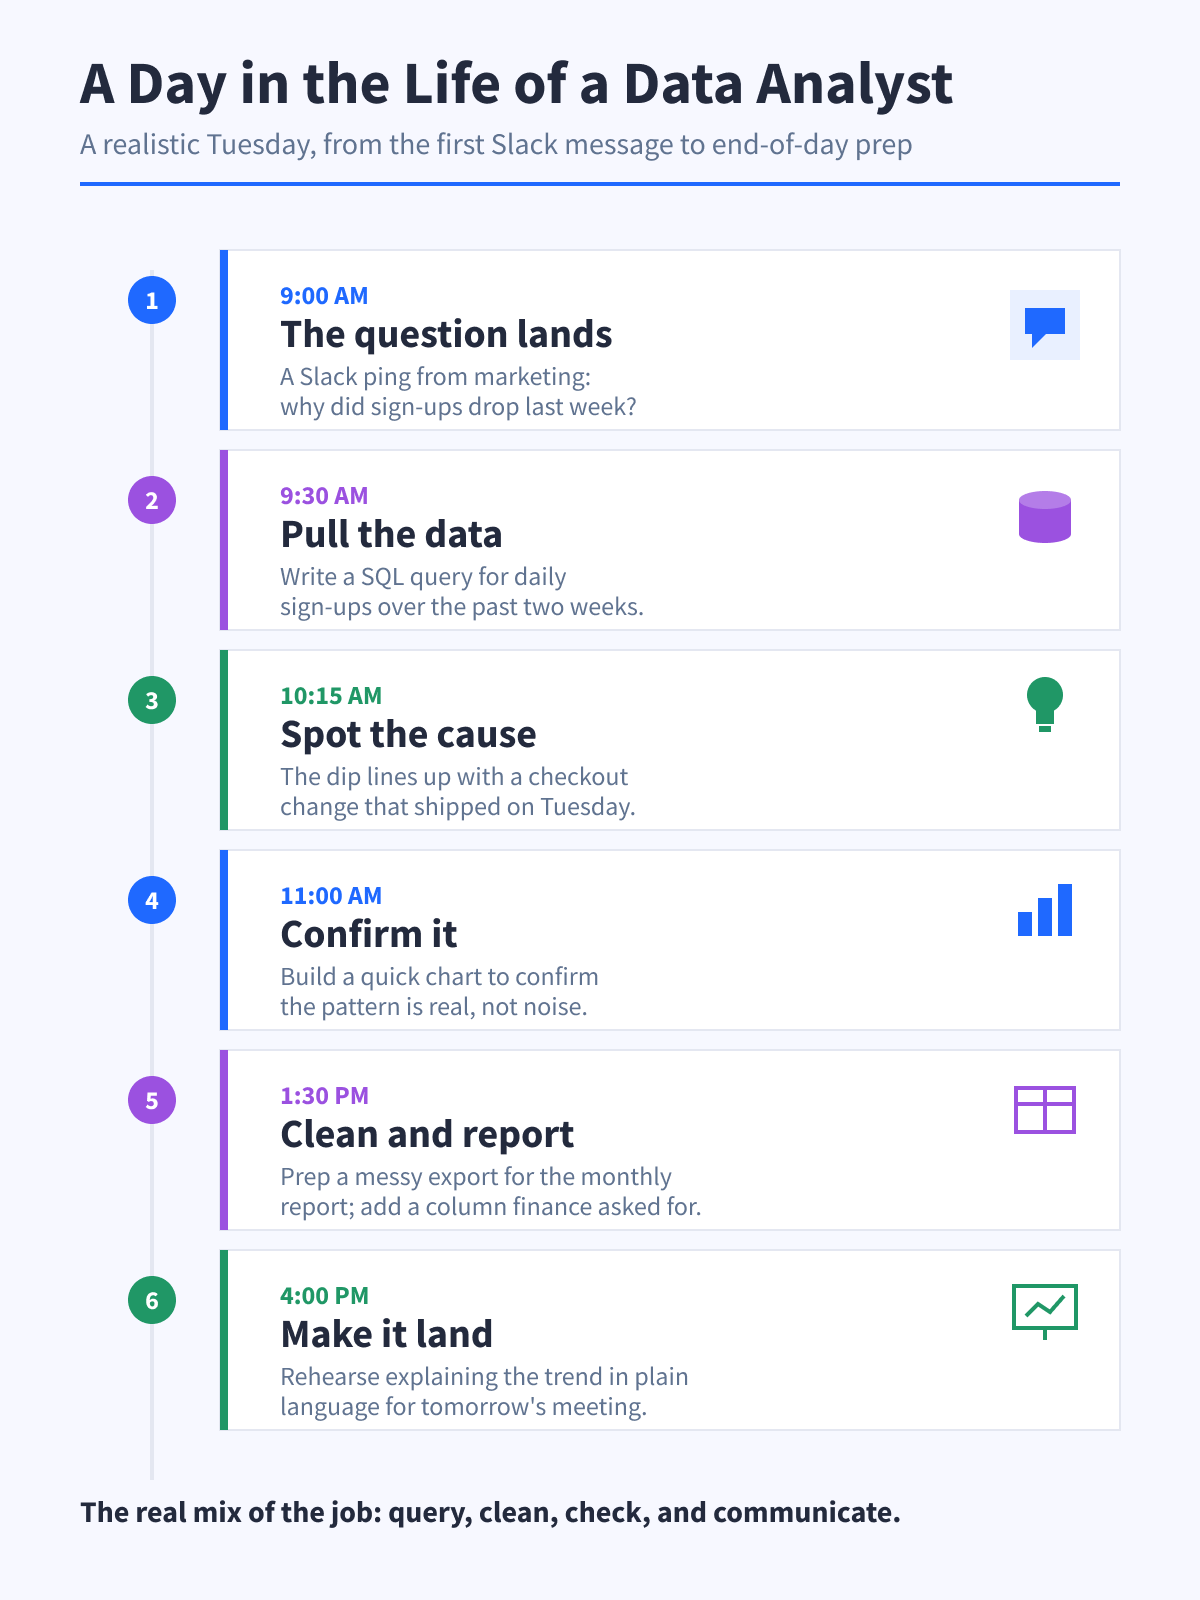
None of these moments is glamorous, and that's the point. The role is a steady mix of querying, cleaning, checking, and communicating, and each one is a learnable skill this roadmap will build.
Core Responsibilities
Most analyst roles come down to five recurring tasks, though the balance shifts by company:
- Pull and combine data from databases, spreadsheets, and tools using SQL and exports.
- Clean and prepare it so the numbers are trustworthy before any analysis begins.
- Analyze and find patterns that answer a specific business question.
- Visualize and report the findings in charts, dashboards, or short written summaries.
- Communicate with stakeholders who need a decision, not a data dump.
That last point matters more than beginners expect. Data analyst Dinesh Kundnani made it plainly in a LinkedIn discussion on breaking into the field:
"Even one project only works if you actually understand the business side of it. I've seen people build fancy dashboards who can't answer, 'So what did the company do with this insight?'" — Dinesh Kundnani, data analyst, on LinkedIn
Data Analyst vs. Related Roles
The data roles overlap, which causes confusion when you're choosing a path. Here's how the analyst role compares to the ones you'll hear about most.
| Role | Primary focus | Example deliverable | Key difference |
|---|---|---|---|
| Data Analyst | Answering business questions | A dashboard explaining why sales dipped | You interpret data for decisions today |
| Data Scientist | Prediction and modeling | A churn-prediction model | You build models that forecast |
| Data Engineer | Building data infrastructure | An automated data pipeline | You build the systems others query |
| Business Analyst | Process and requirements | A recommendation to change a workflow | You focus on the business, lighter on code |
If you're weighing analyst against a business-focused role, our guide on business analyst vs. data analyst breaks down the difference in more detail.
How Long Does It Take to Become a Data Analyst?
Your timeline depends on where you're starting and how much time you can give it each week. These are honest guidelines, not guarantees.
| Starting point | 5 hrs/week | 10–15 hrs/week | 20+ hrs/week |
|---|---|---|---|
| From scratch (no coding) | 8–12 months | 5–7 months | 3–5 months |
| From a data-adjacent role (marketing, finance, ops) | 5–8 months | 3–5 months | 3–4 months |
| Career change, non-technical | 7–10 months | 4–6 months | 3–5 months |
For reference, Dataquest's Data Analyst in Python path is built to take a complete beginner to job-ready in about 8 months at 5 hours a week, which is under an hour a day. Consistency beats intensity every time. Even a few focused hours each week add up faster than you'd think.
The Complete Data Analyst Roadmap
Now that you know the role, here's the full journey in one view. Each phase builds on the one before it, taking you from raw fundamentals to a portfolio that gets interviews. The sequence mirrors the Data Analyst in Python path, so you learn skills in the order they actually build on each other.
The tools below are what you'll pick up along the way. Don't worry if the names are unfamiliar, because learning them is the whole point of this guide.
Want to track your progress? Our downloadable Data Analyst Roadmap Checklist lets you tick off each skill as you master it.
Phase 1: Build Your Foundation
Timeline: about 2–3 months
This phase is about getting comfortable working with data in general, first by writing Python and then by cleaning real datasets. Don't rush it, because everything else builds on these habits.
Skill: Python Programming Fundamentals
Why it matters: Python is the primary language for analysis in this roadmap. It's the most common language in analyst job postings and the foundation for cleaning, analysis, and automation.
What to learn: Core syntax (variables, loops, conditionals, and functions), then the data structures you'll use constantly, especially lists and dictionaries. You need to be fluent enough to work with data confidently, not to become a data scientist.
How to practice: Work through Introduction to Python Programming for structured practice with instant feedback in the browser.
Timeline: About 1 month
Skill: Data Cleaning with pandas
Why it matters: pandas is the analyst's daily workhorse in Python, and real datasets are almost always messy. Cleaning data well is one of the most valuable skills in the whole role.
What to learn: Load data into a pandas DataFrame, select and filter rows, handle missing values, fix inconsistent formats, and reshape and combine datasets. This is where raw files become something you can trust.
How to practice: Build the skills on real data with Introduction to Pandas and NumPy and Data Cleaning and Analysis in Python.
Timeline: About 1–2 months
Milestone Project (Phase 1)
Take a messy public dataset, load and clean it in Python with pandas, and get it ready for analysis. It proves you can turn messy data into something clean and ready to analyze, which is your first portfolio piece. Need a dataset? Start with our list of free datasets for projects.
Phase 2: Analyze and Visualize
Timeline: about 1–2 months
With the fundamentals in place, this phase is about finding patterns and communicating them clearly. This is the part of the job stakeholders actually see.
Skill: Exploratory Data Analysis
Why it matters: Before you can report anything, you need to understand what's in the data. Exploratory data analysis is how you spot trends, outliers, and relationships worth reporting.
What to learn: Summary statistics, grouping and aggregating, and comparing segments. Learn to ask a question, check it against the data, and follow the surprising result.
How to practice: Apply these techniques to a public dataset: ask a question, compute summary stats, group and compare segments, then follow the surprising result.
Timeline: About 2–3 weeks
Skill: Data Visualization
Why it matters: A good chart makes an insight obvious in seconds. Visualization is how analysts turn a finding into something a decision-maker can act on.
What to learn: The core chart types and when to use each: line charts for trends, bar charts for comparisons, histograms for distributions. Then the design principles that separate a clear chart from a cluttered one.
How to practice: Work through Introduction to Data Visualization in Python, which pairs plotting with sound design choices.
Timeline: About 2–3 weeks
Skill: Data Storytelling
Why it matters: A finding only lands when it's framed as a story. Analysts who walk stakeholders from question to answer to recommendation are the ones who get listened to.
What to learn: How to structure an analysis as a story: the question, what you found, and what to do about it. Learn information-design principles that guide a reader's attention to what matters.
How to practice: Build this skill with Telling Stories Using Data Visualization and Information Design.
Timeline: About 2 weeks
Milestone Project (Phase 2)
Explore a dataset, find a pattern worth reporting, and present it as a short visual story that answers a business question. Aim for something a non-technical person could understand in a minute.
Phase 3: Master SQL and Data Sourcing
Timeline: about 2 months
This phase makes you the person who can get data yourself instead of waiting for someone to hand it over. You'll start with the professional workflow tools (command line and Git), then move to SQL, the single most requested technical skill for analysts, and finish with APIs and light web scraping.
Skill: Command Line and Git
Why it matters: Analysts run scripts, move files, and version their work. A little command line and Git makes you look professional and keeps your projects safe.
What to learn: Navigating the filesystem and basic text processing at the command line, plus tracking changes and pushing work to GitHub with Git.
How to practice: Build these with Command Line for Data Science and Introduction to Git and Version Control.
Timeline: About 2 weeks
Short on time? The command line is the priority here. Git can wait until you're ready to publish your first portfolio project.
Skill: SQL
Why it matters: Most company data lives in databases, and SQL is how you reach it. It's the single most requested technical skill for analysts, so this deserves real time.
What to learn: Build up in order, because each step unlocks the next (see the progression table below).
How to practice: Start with Introduction to SQL and Databases and go deep with the full SQL skill path. Then answer real questions with our list of SQL projects to practice.
Timeline: About 1 month
| Stage | What you can do |
|---|---|
| Basics | SELECT, WHERE, ORDER BY to pull and filter data |
| Joins | Combine data across multiple tables |
| Aggregation | GROUP BY with COUNT, SUM, AVG for summaries |
| Subqueries & CTEs | Break complex questions into readable steps |
| Window functions | Running totals, rankings, and period-over-period comparisons |
Skill: APIs, Web Scraping, and Business Context
Why it matters: Sometimes the data you need isn't in a tidy database. Knowing how to pull it from an API or a web page, and how to frame a fuzzy business question, makes you far more self-sufficient.
What to learn: The basics of calling an API and working with JSON, light web scraping, and how to translate a vague request into a measurable question.
How to practice: Work through APIs and Web Scraping in Python and Data Analysis for Business in Python.
Timeline: About 2–3 weeks
Milestone Project (Phase 3)
Answer a set of business questions using SQL against a real database, then put the project on GitHub with a clear README so a hiring manager can find it.
Phase 4: Statistics and Job-Ready Polish
Timeline: about 2 months
The final phase makes your analysis trustworthy and gets you ready to apply. You don't need advanced math, just enough statistics to avoid drawing the wrong conclusion.
Skill: Statistics and Probability for Analysts
Why it matters: Statistics is what separates a real insight from a coincidence. Employers trust analysts who know when a difference is meaningful and when it's just noise.
What to learn: Descriptive statistics, distributions, sampling, and the basics of hypothesis testing. Enough to say "this change is probably real" with confidence.
How to practice: Apply each concept to real data in Introduction to Statistics in Python.
Timeline: About 1 month
Skill: Portfolio Depth
Why it matters: Your portfolio is what gets you the interview. Two or three deep projects beat a dozen shallow ones.
What to learn: Take your best milestone project and go further: document your reasoning, show the messy middle, and end with a clear recommendation. A hiring manager should see how you think.
How to practice: Follow our guide to building and presenting your data portfolio, plus these portfolio-building resources.
Timeline: Ongoing
Skill: Communication and Interview Prep
Why it matters: Analysts are hired to influence decisions, so explaining your work clearly is part of the job. It's also the most common reason strong technical candidates get passed over.
What to learn: Practice summarizing a finding in two sentences, presenting to a non-technical audience, and walking through your portfolio out loud. Review the skills employers screen for in our guide to the data analyst skills that get you hired in 2026.
How to practice: Rehearse a mock interview: explain one project end to end, then talk aloud through a SQL question as if the interviewer were watching.
Timeline: Ongoing
Interviewers care more about your reasoning than your recall. People analyst Sidra Jamal captured this in a LinkedIn thread on analyst interviews:
"Interviewers aren't grading the syntax, they're watching how you think when you don't immediately know. A wrong answer reasoned well beats a right answer that appeared by magic." — Sidra Jamal, people analyst, on LinkedIn
Milestone Project (Phase 4)
Build one end-to-end capstone that pulls data with SQL, cleans and analyzes it in Python, visualizes the result, and ends with a recommendation. This is the centerpiece of your portfolio.
Common Mistakes to Avoid
A few predictable mistakes slow down most beginners. Knowing them in advance saves you months:
- Tutorial hell. Watching endless courses without building anything feels productive but teaches you little. Build a small project after every skill.
- Skipping SQL. It's less exciting than Python, but it appears in nearly every job posting. Don't put it off.
- Ignoring business context. A technically perfect analysis that answers the wrong question helps no one. Always start from the decision someone needs to make.
- No public portfolio. If a hiring manager can't see your work, it doesn't count in the search. Put projects on GitHub early.
- Trying to learn every tool at once. Pick one language and one path. Breadth comes later.
- Waiting until you feel "ready" to apply. You'll never feel fully ready. Start applying once you have two solid projects.
Your Next Steps
Becoming a data analyst in 2026 is very achievable, and the plan is simpler than the internet makes it look. Foundations first, with Python and data cleaning. Then analysis, visualization, and storytelling. Then SQL and getting data yourself. Then statistics and the portfolio that gets you hired.
The market is more competitive than it was a few years ago, but the path is doable and the fundamentals still carry the job. Many working analysts started exactly where you are now, curious and unsure where to begin.
You don't need to have the whole journey figured out today. You need a first move. This week, do three things:
- Pick a dataset you genuinely care about.
- Answer one question about it in Python.
- Create a GitHub account to store your work.
That bias toward building is exactly what practitioners recommend, as one commenter put it in a recent r/dataanalysiscareers thread:
"Practically implementing what you learn by making projects is key, and you're gonna learn more in that way." — Superb_Donkey_9608, r/dataanalysiscareers
A first skill this week is worth more than a perfect plan next month. When you're ready to follow this roadmap step by step, the Data Analyst in Python Career Path takes you from your first line of code to a job-ready portfolio.
Frequently Asked Questions
Is data analysis the right fit for me?
You'll likely enjoy it if you like solving puzzles, asking "why is this number doing that?", and finding a clear story inside messy information. It might frustrate you if you want fast, flashy results with no cleanup, or if you'd rather build products than investigate questions. The best way to find out is to try a small project before committing months.
Can I become a data analyst without a degree?
Yes. Employers increasingly hire on demonstrated skill, and a portfolio of real projects can outweigh a formal credential for entry-level roles. A structured path like the Data Analyst in Python Career Path gives you both the skills and the projects to show for them.
Do I need to learn Python, or is SQL and Excel enough?
SQL and spreadsheets are the backbone of most analyst work, and a few smaller roles lean mostly on them. But in a more competitive market, Python and a project portfolio meaningfully widen the range of jobs you can win. If you're short on time, learn SQL first, then add Python.
Do I need advanced math to be a data analyst?
No. You need applied statistics, such as averages, distributions, and basic hypothesis testing, not calculus or linear algebra. The math you'll actually use is closer to careful reasoning than to a theory exam.
What's the difference between a data analyst and a data scientist?
Analysts focus on answering business questions with existing data, while data scientists build models that predict future outcomes. Analysis is the more common entry point and a natural stepping stone. If you're curious about the next step, see our data scientist roadmap.
What should my first portfolio project be?
Pick a topic you care about, find a public dataset, and answer one clear question end to end. A focused project you can explain beats an ambitious one you can't. Our list of SQL projects to practice is a good place to find ideas.