

What Is Data Science? A Plain-English Guide With a Worked Example
What is data science? It's the work of using data to answer questions and make better decisions. You see it at work when a weather app predicts rain or a streaming service suggests a show.
This guide explains data science in plain words. You'll get a short definition and see where data science shows up in daily life. Then you'll follow one small project from first question to final answer.
You'll also see how artificial intelligence (AI) fits in. By the end, you'll know what the work involves and where to start if it fits your goals.
Table of Contents
- What is data science?
- Where do you see data science in everyday life?
- How does data science work, step by step?
- What does a small data science project look like?
- How does AI fit into data science?
- How is data science different from AI and analytics?
- What does a data scientist do?
- What skills and tools does data science use?
- Where did data science come from?
- How can you start learning data science?
- Your next step
- Frequently asked questions
What is data science?
Data science is using data to answer questions and make better decisions. You collect information, clean it up, look for patterns, and share what you found so someone can act on it.
The U.S. National Institute of Standards and Technology (NIST) describes data science as a field that combines three things. NIST's definition lists "domain expertise, programming skills, and knowledge of mathematics and statistics." Domain expertise means knowing the subject you're studying, like sports, health, or sales.
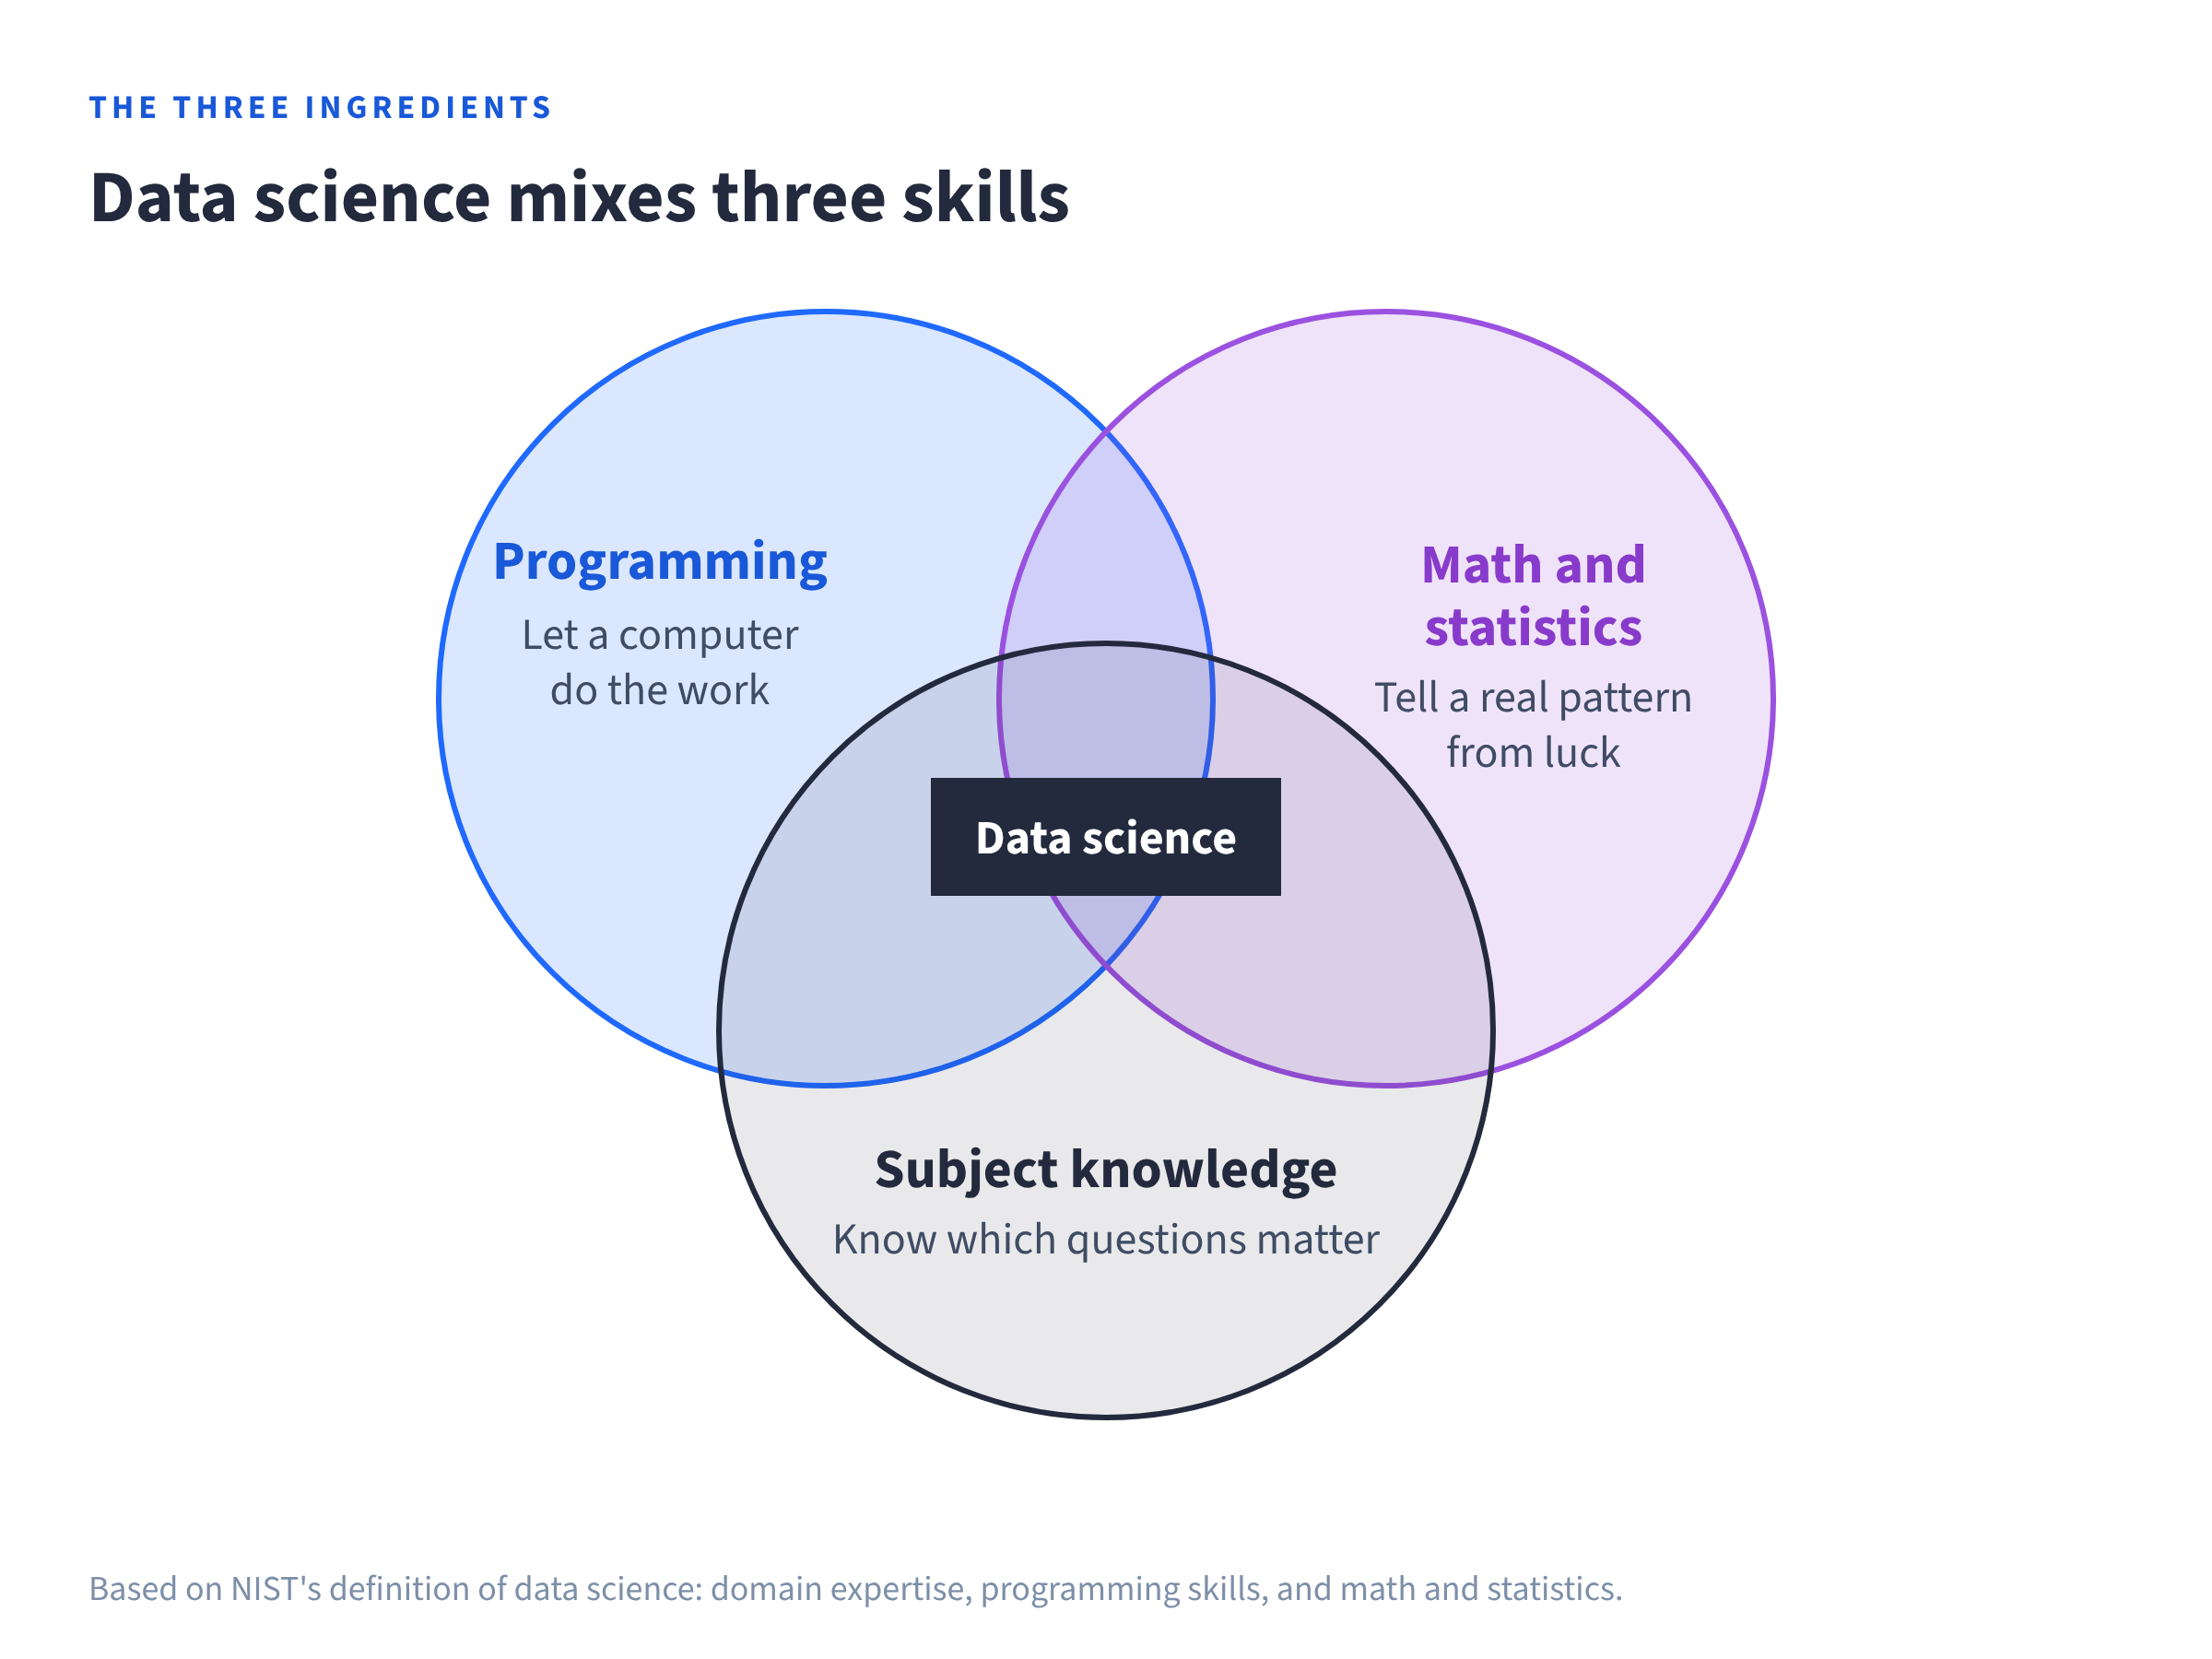
Each skill does a different job.
- Programming lets a computer do the work on thousands of rows.
- Statistics helps you judge whether a pattern is real or just luck.
- Subject knowledge tells you which questions are worth asking.
Data comes in many forms. It can be numbers in a spreadsheet, words in reviews, clicks on a website, or photos.
Where do you see data science in everyday life?
You use the results of data science most days, often without noticing. In the table below, each example is described by the group that runs it.
| Example | Question the data answers | Data used |
|---|---|---|
| Weather forecasts | Will it rain tomorrow? | Weather readings, fed into computer models |
| Disease tracking | Is a virus spreading in my area? | Samples from wastewater, tested for signs of illnesses like the flu and COVID-19 |
| Streaming recommendations | What show might you like next? | What you've watched, how you rated titles, the time of day, and your device |
The National Weather Service says computer modeling is "fully ingrained in the forecast process." Its forecasters review model output every day.
The Centers for Disease Control and Prevention (CDC) runs a wastewater monitoring program. It tests sewage to track diseases in a community. The CDC updates this data every Friday.
Netflix explains that its suggestions come from your viewing history and ratings, among other things. It also says it doesn't use your age or gender.
Each example starts with a question. Then it uses data to answer it. That pattern is the heart of data science.
How does data science work, step by step?
Many data science projects follow steps like the six below. Not every project uses all of them. Some stop after exploring the data or running a statistical test, with no model at all.
Real projects also loop back, because what you find in one step can change an earlier one.
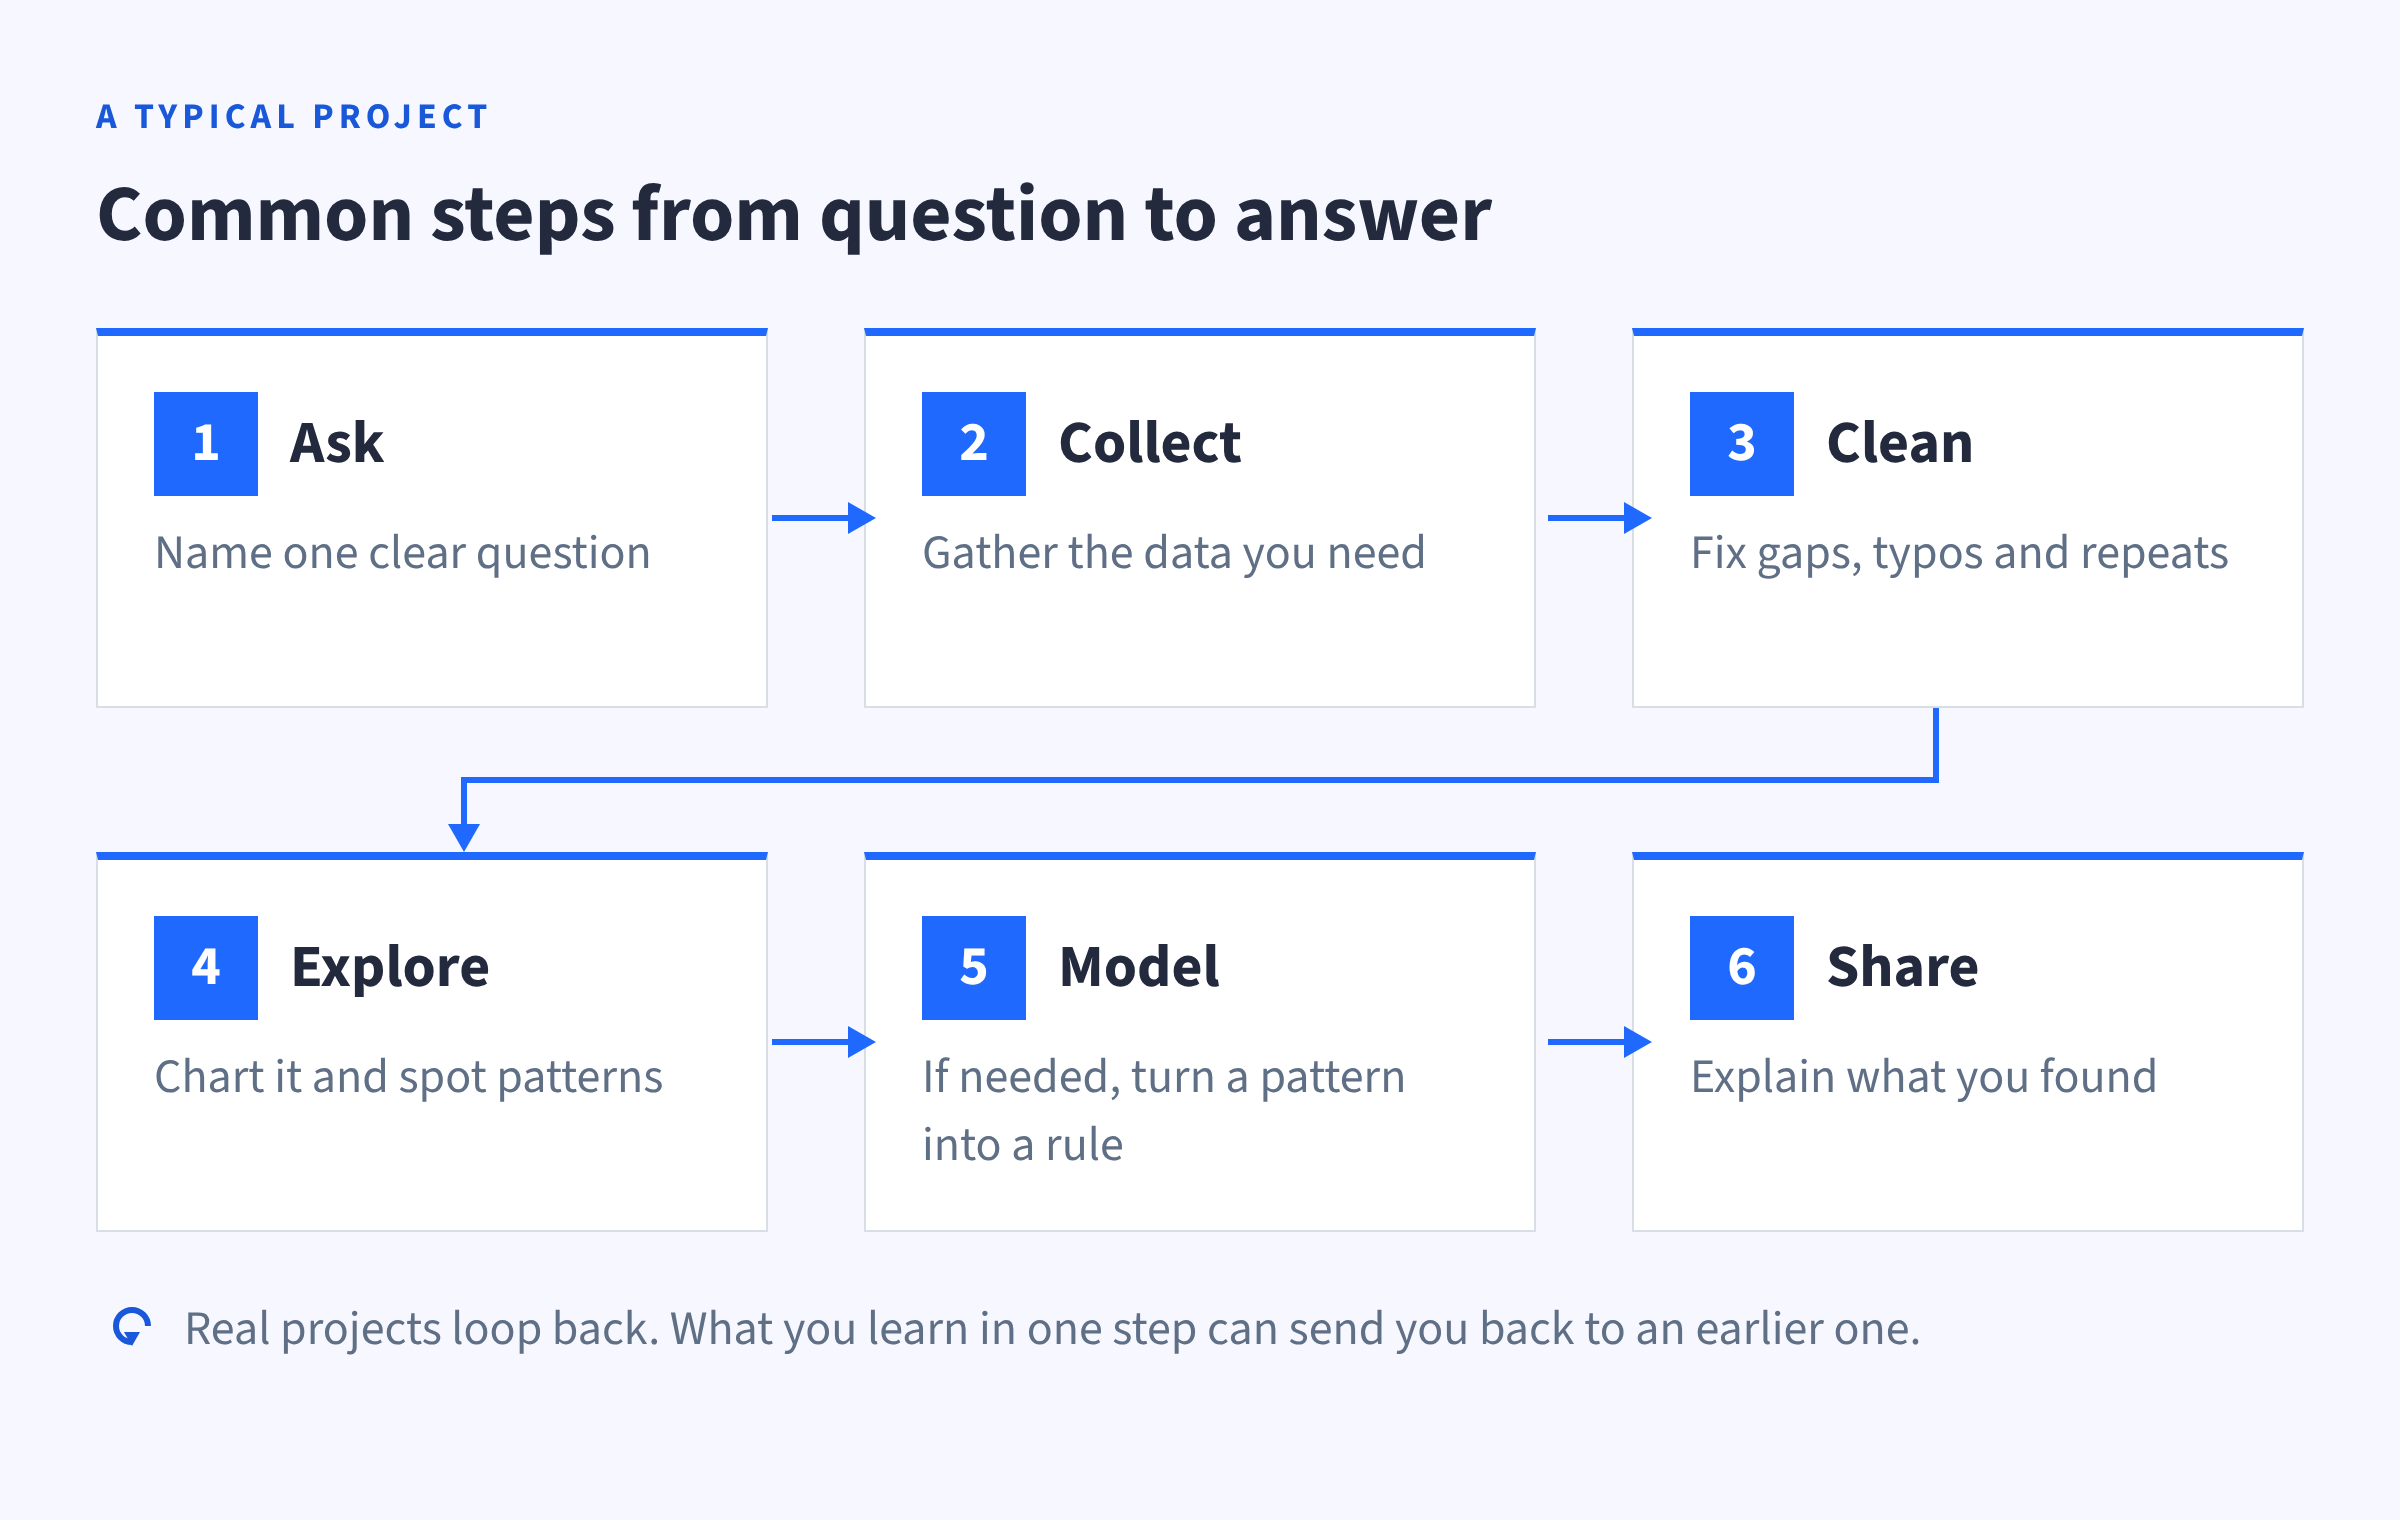
- Ask a question. A clear question tells you what data you need. "Are sales going up?" is easier to answer than "What's going on with sales?"
- Collect the data. You need data that matches your question. This might mean downloading a file, pulling records from a database, or writing things down by hand.
- Clean the data. Real data has gaps, typos, and repeats. If you skip this step, you can get the wrong answer.
- Explore the data. You make charts and quick summaries to see what stands out.
- Model the data, if you need to. A model is a simple math rule that describes a pattern, and you can use it to make a prediction. Many projects skip this step and share what they found while exploring.
- Share what you found. A finding only helps if someone understands it. That might be one sentence, a chart, or a short report.
Cleaning can take a lot of time. It's also where many mistakes get caught, as the next example shows.
What does a small data science project look like?
Let's walk through all six steps with one tiny project. Your friend runs a small coffee cart, and you're helping with the data.
The numbers below are made-up sample data. They're small on purpose, so you can see every step.
Step 1: Ask a question
Your friend wonders if people buy different drinks on hot days. So you ask one clear question. Do hotter days go with more iced drinks sold?
A good question names what you'll measure. Here, that's the day's high temperature and the number of iced drinks sold.
Step 2: Collect the data
Your friend kept notes for 10 days. You type them into a table. A table of data like this is called a dataset.
| day | high_temp_f | iced_drinks |
|---|---|---|
| Mon | 68 | 22 |
| Tue | 72 | 25 |
| Wed | 75 | 31 |
| Thu | 81 | 38 |
| Fri | 85 | 44 |
| Sat | 90 | 52 |
| Sun | 88 | (blank) |
| Mon | 79 | 35 |
| Tue | 70 | 240 |
| Wed | 84 | 41 |
Look closely and you'll spot two problems. Sunday has no number. And 240 iced drinks on a cool Tuesday looks wrong.
Step 3: Clean the data
You check your friend's notes about the 240. They say 24, so someone typed an extra zero.
Sunday's number is missing, and there's no way to get it back. So you remove that row instead of making up a number.
Here's how that looks in Python, using a tool called pandas. The pandas library helps you work with tables of data.
import pandas as pd

sales = pd.DataFrame({
    "day": ["Mon", "Tue", "Wed", "Thu", "Fri", "Sat", "Sun", "Mon", "Tue", "Wed"],
    "high_temp_f": [68, 72, 75, 81, 85, 90, 88, 79, 70, 84],
    "iced_drinks": [22, 25, 31, 38, 44, 52, None, 35, 240, 41],
})

# Fix the typo you checked in the notes, then drop the blank row
sales.loc[sales["iced_drinks"] == 240, "iced_drinks"] = 24
sales = sales.dropna()
Step 4: Explore the data
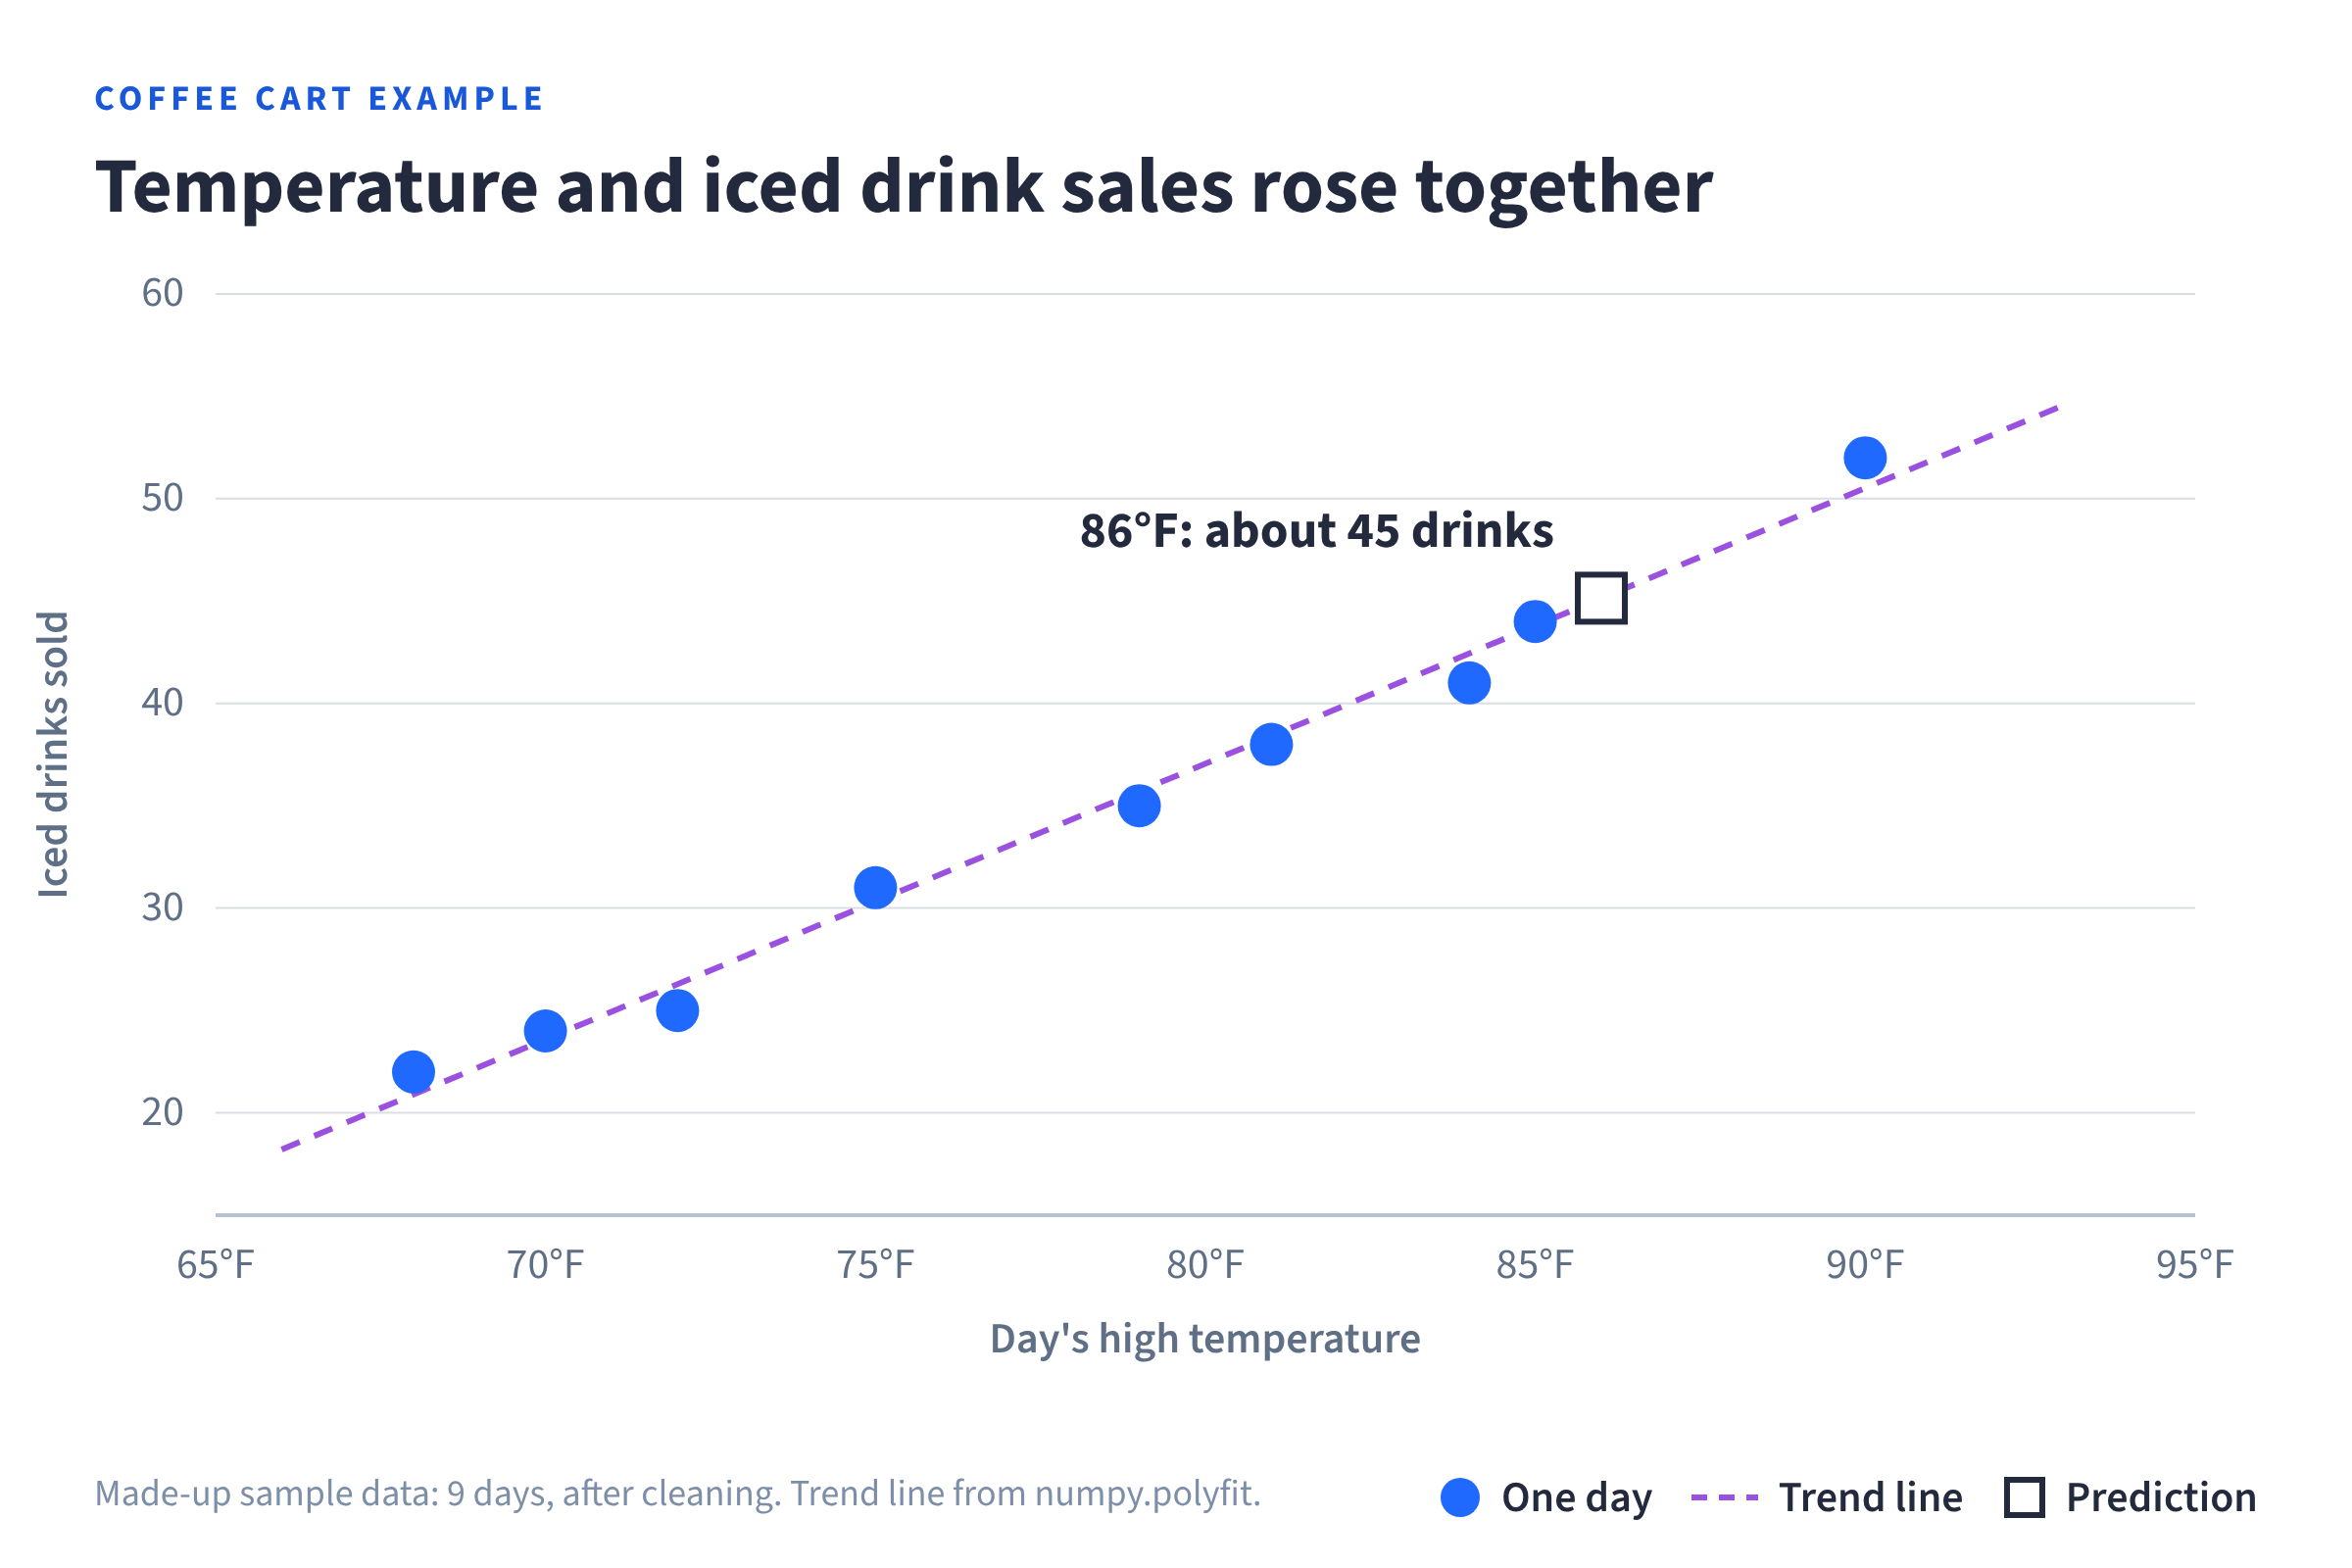
Now you plot each day as a dot. Temperature goes along the bottom, and iced drinks go up the side. The dots climb from left to right.
You can also measure how closely the two columns move together with a number called correlation. It runs from -1 to 1.
A score near 1 means when one goes up, the other goes up too. A negative score means one goes down as the other goes up.
print(round(sales["high_temp_f"].corr(sales["iced_drinks"]), 2))0.99With the 240 typo left in, the same code prints -0.29. That would suggest hot days go with fewer iced drinks, which is the opposite of what the clean data shows.
Step 5: Model the data
A model turns the pattern into a rule you can use. Here, the rule is a straight line through the dots. This is called a trend line.
import numpy as np

slope, intercept = np.polyfit(sales["high_temp_f"], sales["iced_drinks"], 1)
print(round(slope, 1))
print(round(slope * 86 + intercept))
1.3
45The first number says each extra degree goes with about 1.3 more iced drinks. The second is a prediction. On an 86°F day, the line expects about 45 iced drinks.
Step 6: Share what you found
A short, careful note works best for your friend. "So far, hotter days have gone with more iced drink sales. It may be worth stocking a few extra when it's hot. On an 86°F day, about 45 is a fair first guess."
The wording is careful for a reason. The numbers show that heat and iced drink sales rise together, which is called a correlation. They don't prove that heat causes the extra sales.
Be honest about the limits, too. Nine days is a tiny sample, and other things might matter, like weekends or nearby events.
A good next step is to keep collecting data for a few more weeks. To try projects like this yourself, browse these data science project ideas.
How does AI fit into data science?
AI and data science are closely linked. Data science helps build AI, and AI tools now help people do data science.
| Idea | What it means | What you still do |
|---|---|---|
| Data science for AI | AI models learn from data, so the data has to be collected, cleaned, and checked | Spot bad data before a model learns from it |
| Data science with AI | AI assistants can write code, explain errors, and suggest charts | Check every answer and decide if it makes sense |
Data science for AI
AI is a computer system that can do tasks that seem to need human thinking. Many AI tools learn from huge amounts of data. If the data is messy, the AI can learn the wrong lessons.
Google's machine learning course says the quality and size of the data matter more than which "shiny algorithm" you use.
Think back to the coffee cart example. Before you trusted the iced drink numbers, you fixed the 240 typo and dropped the blank Sunday row. Those same skills carry over to AI.
Cleaning data, measuring patterns, and making predictions are the same skills used to build and check AI models. The Bureau of Labor Statistics (BLS) expects companies to keep adding AI systems to their work.
Data science with AI
AI assistants like ChatGPT, Claude, and GitHub Copilot can now write and explain code. Many people use them. In the Stack Overflow 2025 Developer Survey, 84% of developers said they use or plan to use AI tools in their work.
The same survey shows why you still need to know the basics. Only 3.1% of developers said they "highly trust" the accuracy of AI output. And 66% named "AI solutions that are almost right, but not quite" as a frustration.
An AI tool could have written the cleaning code above. But it couldn't confirm the right number without your friend's notes.
You found the answer by checking the notes. Learning what to check is a skill you build with practice.
AI can also help you learn. At Dataquest, our AI tutor Chandra explains code, answers questions, and helps you work through exercises inside the lesson. For more on this shift, read about the evolution of AI in data science.
How is data science different from AI and analytics?
These terms overlap, which is why they're easy to mix up. Data science is the big umbrella. The others are parts of it or close neighbors.
| Field | Main question | Example | How it relates to data science |
|---|---|---|---|
| Data analytics | What happened, and why? | A report showing last month's sales by store | A core part of data science, focused on past data |
| Machine learning | What pattern can a computer learn from examples? | A spam filter that learns from emails you mark | A set of tools data scientists use to make predictions |
| Artificial intelligence | Can a computer do a task that seems to need human thinking? | A chatbot or a voice assistant | A broader goal. Machine learning is one way to reach it |
| Data engineering | How do we move and store data so others can use it? | Building a system that collects sales data every night | A neighbor field that gets data ready for data scientists |
The coffee cart project sits mostly in analytics, because you cleaned and charted past sales. The trend line uses a statistical method (linear regression) that's also used in machine learning.
To go deeper, read about the difference between deep learning and machine learning. Or compare two careers in data science vs data engineering.
What does a data scientist do?
A data scientist does work like the steps above, usually on much bigger data. Not every project ends in a model. Many focus on exploring data, running experiments, or describing what happened. The BLS says "Data scientists use analytical tools and techniques to extract meaningful insights from data."
In plain words, they turn raw data into answers people can use. On a normal week, a data scientist might:
- Meet with a team to turn a vague goal into a clear question, so the work answers what people need
- Write code to clean data, because real data often arrives with gaps and typos
- Build and test models when a project needs predictions, to see which model works best
- Make charts and short reports, so people who don't code can act on the results
The BLS also shares pay and job figures for data scientists.
| Data scientists at a glance | Figure |
|---|---|
| 2025 median pay | $120,230 per year |
| Number of jobs, 2025 | 275,600 |
| Job outlook, 2025–35 | 35% growth, "much faster than average" |
| Openings each year | About 24,800, on average |
| Typical entry-level education | Bachelor's degree |
Source: BLS Occupational Outlook Handbook. Median pay means half earned more and half earned less. The pay figure leaves out self-employed workers.
The BLS also notes that some employers require or prefer a master's degree or PhD. For a closer look at pay and duties, see our data scientist job description and salary guide. You can also explore in-demand data science jobs.
What skills and tools does data science use?
You don't learn everything at once. It helps to build skills in order, so each one rests on the last. This table follows the order of the main skills in the Data Scientist in Python path.
| Skill | What it's for |
|---|---|
| Python | Writing instructions so the computer can work with data |
| pandas and charts | Organizing tables and drawing pictures of the data |
| Data cleaning | Fixing gaps, typos, and repeats before you trust the data |
| SQL | Pulling data out of databases. SQL stands for Structured Query Language |
| Statistics | Judging if a pattern is real or luck |
| Machine learning | Teaching a computer to make predictions from examples |
Python and SQL are two of the most used languages around.
In the Stack Overflow 2025 Developer Survey, 58.6% of developers said they'd used SQL a lot in the past year. Python was close behind at 57.9%. Keep in mind this survey asked developers in general, not only data scientists.
You'll also hear about other tools. Our list of data science tools for beginners covers them. If you're choosing a language, read our take on Python vs R.
Where did data science come from?
Data science grew out of statistics and computer science. The name took a while to stick.
| Year | What happened |
|---|---|
| 2001 | Statistician William S. Cleveland published "Data Science: An Action Plan for Expanding the Technical Areas of the Field of Statistics." It argued that statistics should grow to include more computing |
| About 2008 | Harvard Business Review later credited DJ Patil and Jeff Hammerbacher with coining the job title "data scientist" |
| 2012 | Harvard Business Review called data scientist "The Sexiest Job of the 21st Century" |
| 2022 | The same authors asked if that was still true, and looked at how the job had changed |
Today, data science is its own field with its own job title.
How can you start learning data science?
Start with Python and small projects like the coffee cart. Building small projects helps new skills stick.
| If you want to... | Start with | Time (as stated by the path) |
|---|---|---|
| Learn the full field, including machine learning | Data Scientist in Python path | About 9 months at 5 hours a week |
| Focus on analysis and reports first | Data Analyst in Python path | About 8 months at 5 hours a week |
If you'd like to start with analysis, the Data Analyst in Python path covers Python, cleaning, SQL, and statistics. It doesn't include a machine learning section, so you can add that later.
For a study plan, read how to learn data science. For a phase-by-phase plan with timelines, see our data scientist roadmap.
Your next step
Data science is using data to answer questions and make better decisions.
In many projects, you ask a question, collect data, clean it, and explore it. Sometimes you build a model. Then you share what you found.
AI tools can speed up parts of that work, but you still decide what to check.
The Data Scientist in Python path teaches the skills used in this guide's example.
| Data Scientist in Python path | Details |
|---|---|
| Courses | 38 |
| Projects | 27 |
| Time | About 9 months at 5 hours a week |
| Covers | Python, pandas, data cleaning, SQL, statistics, machine learning, and deep learning |
You learn by writing real code and building projects. If you want to see the full road to the job, read how to become a data scientist.
Frequently asked questions
Is data science hard to learn?
It takes steady work, and some topics can be tricky. You learn it in small steps, and each skill builds on the last. Beginner paths, like ours, start from the very first line of Python.
Do I need a degree to become a data scientist?
Not always. Projects that show your skills count, because they show you can do the work. Still, the BLS lists a bachelor's degree as typical, so check what the roles you want ask for.
How much math do I need for data science?
You need statistics and some algebra to start. Calculus and linear algebra come up later, mostly in machine learning. Learning math through code helps, because you can see what each idea does.
Should I learn Python or R first?
We recommend Python if you're new to coding. It's used for data work and for many other jobs, so the skill travels. R is strong for statistics, and you can add it later.
Can I learn data science on my own?
Yes. It helps to follow a set order, so you don't skip key skills. Finishing small projects, like the coffee cart example, keeps you on track.
Do I need a powerful computer for data science?
No. A normal laptop can handle Python, pandas, and small datasets. You'll only need more power for very large data or advanced deep learning.