8 Data Analyst Skills Employers Want to See on Your Resume
Although you probably won't be that surprised to hear this, data analyst skills remain in high demand. According to the U.S. Bureau of Labor Statistics, data-focused roles show strong growth across many industries. Organizations rely on data analytics skills to translate raw information into actionable insights. But what does it actually take to become one of these in-demand experts with the skills required to be a data analyst? Keep reading to find out!
In this comprehensive guide, I'll lay out the 8 essential data analyst skills you need to succeed in a data analyst role. From data cleaning and statistical analysis to data visualization and communication, I'll break down the key competencies that will set you apart in the job market. Plus, we'll take a look at how generative AI is reshaping the field of data analytics, creating new paths for those open to continual learning.
Whether you're a recent graduate looking to start your career or a professional wanting to upskill, this post will give you a roadmap to becoming a sought-after data analyst.
Data Analyst Skills or Data Analyst Tools?
When it comes to data analysis, the specific tools you use will vary depending on your role, company, and industry. That's why, rather than focusing on any one particular tool, we're going to zero in on the foundational skills you need to succeed.
Now, don't get me wrong, learning popular data analysis tools is still important. After all, you'll need to know how to put your skills into practice. But trying to decide between Python, R, Excel, Tableau, or Power BI can quickly become overwhelming, especially when you're just starting out. My advice? Focus on building a strong skill foundation first. Think of it like learning to cook. Once you understand the basic techniques, you can start experimenting with different recipes and ingredients to create your perfect dish.
The Rule Breaker

The one exception to this rule is SQL. As the industry standard for querying databases, SQL is a must-have for any aspiring data analyst. Many agree that learning SQL has significantly boosted their career prospects.
Throughout this post, you'll notice that the provided examples use a variety of tools. This is intentional. I want to show you that having the right combination of data analytics skills is more important than mastering any one piece of software. Plus, by seeing how these skills can be applied across different platforms, I hope you'll be inspired to explore and (eventually) learn as many of them as you can.
So, what do you think are the most sought-after data analyst skills employers are looking for? Take a moment to ponder that. In the next section, I'll reveal the top 8 skills needed for data analyst positions right now. Let's get into it!
The Top 8 Data Analyst Skills

So, what does it really take to stand out as a data analyst in today's competitive market? While the specific tools you use may vary, these are 8 core skills that form the foundation of any successful data analyst's toolkit:
- Clean and Prepare Data
- Explore and Analyze Data
- Statistical Knowledge
- Data Visualizations
- Dashboards and Reports
- Writing and Communication
- Domain Knowledge
- Problem Solving
Over the next several sections, we'll examine each of these skills in detail. You'll learn why they matter, how they're applied on the job, and see real-world examples that demonstrate their importance. By the end, you'll have a clear idea of how to build the skill set you need to land your dream data analyst job.
1. Clean and Prepare Data

If you open up your favorite search engine right now and search for "Time spent cleaning data," I'm almost positive you'll see this statistic all over the place: "Data professionals spend 80% of their time on data cleaning and preparation." There's also a long-running joke in data community that says they spend the other 20% of their time complaining about the quality of the data. While the exact percentages are up for debate, one thing is clear: this is one of the top skills required to be a data analyst.
What's Involved in this Process?
In a nutshell, cleaning and preparing data involves transforming raw data into a usable format for analysis. This typically includes things like:
- Retrieving data from various sources (databases, spreadsheets, APIs, etc.)
- Handling missing, duplicated, or inconsistent values
- Reformatting fields and reshaping the data structure
- Merging datasets from multiple sources
- Validating and checking data quality
If you don't perform this step well, your analysis may rest on shaky foundations. Imagine trying to draw insights from a customer dataset full of invalid email addresses or inconsistent date formats. The results could be unreliable at best and misleading at worst.
Data Cleaning in Action
Let's look at a quick example using the Adult dataset from the UCI Machine Learning Repository. This dataset, despite its age, remains a popular choice for benchmarking data analysis skills. It contains anonymized records with attributes like age, education, occupation, and income. Below is a brief example showing how you might load the data, check for missing values, and remove them using Python:
import pandas as pd

data = pd.read_csv('adult.csv')
missing_values_before = data.isna().sum()
missing_values_before = missing_values_before[missing_values_before > 0]
print("Missing values before handling:\n", missing_values_before)

data.dropna(inplace=True)

missing_values_after = data.isna().sum()
missing_values_after = missing_values_after[missing_values_after > 0]
print("\nMissing values after handling:\n", missing_values_after)Output:
Missing values before handling:
workclass        963
occupation       966
native-country   274
dtype: int64

Missing values after handling:
Series([], dtype: int64)
Here, we use pandas to load the dataset, call isna().sum() to see the missing values in each column, then remove any rows that contain missing data with dropna(). The result shows there are no missing values afterward.
Data Cleaing Advice
This is just the tip of the iceberg when it comes to data cleaning. But it does illustrate how a few lines of code can make a big difference in the quality of your data. That said, dropping rows with missing values isn't always the best solution. Removing rows can reduce your dataset size and introduce bias if the missing data isn’t random. Instead, you can try alternatives like imputing missing values with the mean, median, or mode. You can also try advanced techniques like predictive imputation. These approaches help preserve more of your data while still keeping your analysis robust.
While data cleaning may not be the most glamorous part of a data analyst's job, its advantages and benefits make it well worth your effort. By taking the time to understand your data and address any issues upfront, you'll be setting yourself up for analysis success down the line. If you want to practice data cleaning, check out our free guided project on Exploring Hacker News Posts. It's a great way to refine your data cleaning skills.
2. Explore and Analyze Data

I know, it seems obvious to have "analyze data" in a list of data analytics required skills, but the ability to explore and analyze data is extremely important. But what exactly does that mean?
At its core, data analysis is all about using data to answer specific questions. As a data analyst, you'll be tasked with taking a business question or need and digging into the relevant data to develop insights and solutions. This could involve anything from calculating key metrics to identifying trends and patterns.
Data exploration, on the other hand, is about going into the data to uncover interesting relationships or trends that could potentially bring value to the business. While exploration might be guided by a specific question, it can also be more open-ended―you might just be looking to see what the data can tell you.
Example Using SQL
Let's look at a quick example using SQL to explore the Adult dataset:
SELECT
    education,
    AVG(hours_per_week) AS avg_hours,
    AVG(case when income = '>50K' then 1 else 0 end) AS pct_high_income
FROM
    adult
GROUP BY
    education;
This query groups the data by education level and calculates two things: the average hours worked per week (AVG(hours_per_week)) and the percentage of higher-income earners (AVG(case when income = '>50K' then 1 else 0 end)) within each group. By comparing these metrics across education levels, we can start to see how education might relate to work hours and income.
Developing your ability to conduct both structured analysis and open-ended exploration will be invaluable in uncovering meaningful insights. While AI tools are steadily enhancing efficiency, these are still required skills for data analysis. If you’re aiming to advance in your career, there’s no better time than now to start building your SQL skills.
3. Statistical Knowledge

Being comfortable with statistical concepts is a key skill to be a data analyst. A solid grasp of statistics will guide your data exploration, help you draw valid conclusions, and prevent common mistakes in your analysis.
Here are a few important statistical topics to help expand your data analytics qualifications:
- Correlation: Understanding the relationship between two variables.
- Regression: Modeling how one or more independent variables relate to a dependent variable.
- Hypothesis testing: Evaluating whether a hypothesis about a population is supported by sample data.
The extent of statistical knowledge you need can vary with your role and industry. If your organization depends heavily on probabilistic models, the depth of expertise you’ll need is higher.
Applying Statistics with Excel
For a practical look at these data analytics skills, consider how statistics can be applied to the Adult dataset in Excel. Built-in functions and the Analysis ToolPak add-in make it possible to perform sophisticated statistical analysis without complex code.
For instance, calculating the correlation between age and hours-per-week in Excel might look like this:
- Install the Analysis ToolPak.
- Select the
ageandhours-per-weekcolumns. - Go to Data > Data Analysis > Correlation.
- Specify your input range and click OK.
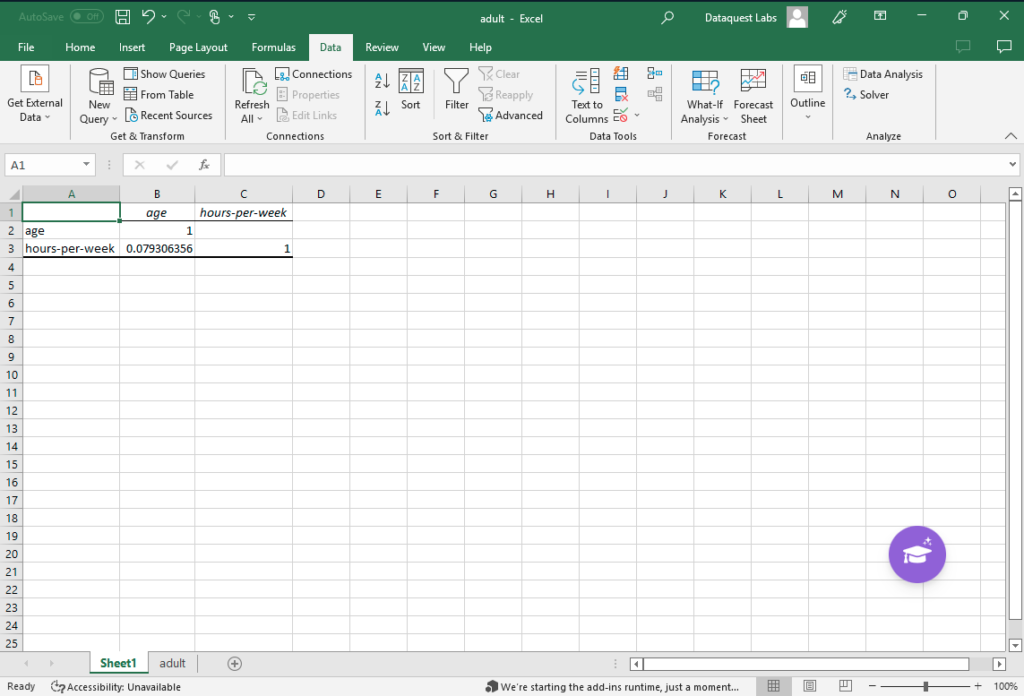
The resulting correlation matrix might show that the relationship between these variables is minimal. Excel also allows you to perform regression analysis and hypothesis tests. This makes it a convenient starting point for building your statistics skills.
Advanced Statistics with R
For more advanced statistical work, many professionals rely on R. Its wide range of packages and robust data manipulation features make it a top choice among data analysts and data scientists.
Whether you’re new to R or looking to broaden your statistical knowledge, these skills will serve you well in any data analyst role. By understanding the underlying concepts behind your numbers, you’ll be equipped to deliver better insights, support evidence-based decisions, and stand out with the skills needed for a data analyst in today’s market.
4. Data Visualizations
Data visualizations are a powerful tool for uncovering trends and patterns in your data. By presenting information visually, you can help others quickly grasp key insights that might be hidden in a spreadsheet of numbers. In fact, research shows that the human brain processes visual information 60,000 times faster than text. That's up to three times faster than blinking!
As a data analyst, creating clean, compelling visualizations will be a core part of your job. This means choosing the right type of chart for your data, designing visuals that are easy to interpret, and avoiding common pitfalls like overcrowding your charts or distorting the data with misleading axis values.
But data visualization isn't just about presenting your findings to others. It's also a key part of the data exploration process. Sometimes patterns or outliers will jump out at you in a visual format that you might have missed by looking only at the raw numbers.
Creating Interactive Visualizations with Tableau
Let's look at an example of creating visualizations using Tableau and the Adult dataset. Tableau's intuitive drag-and-drop interface makes it a great choice for quickly exploring your data visually.
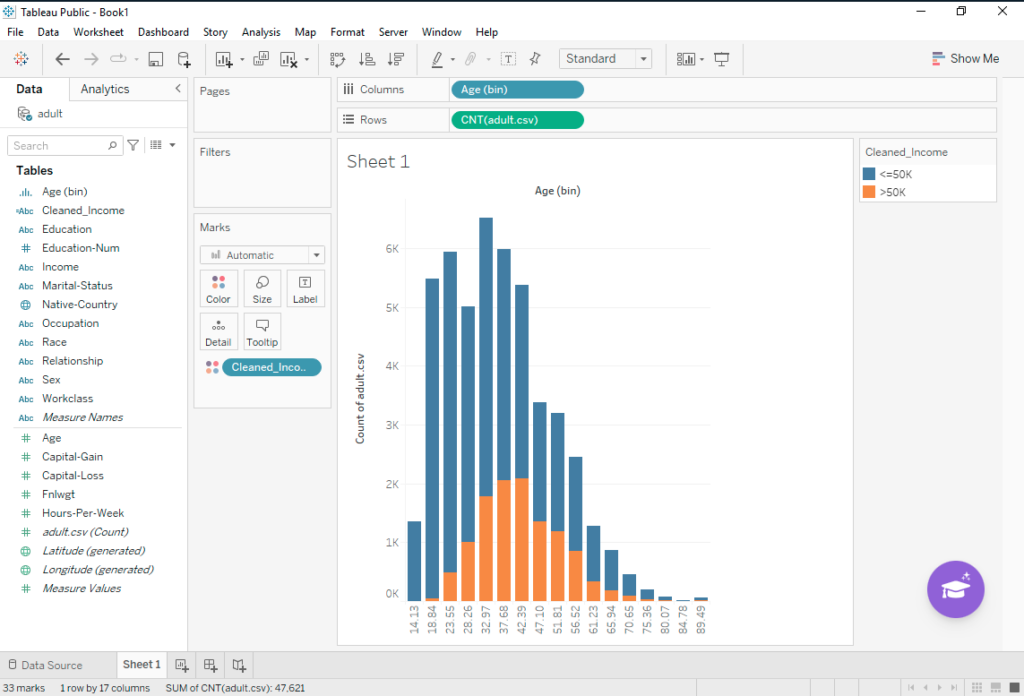
Suppose we want to visualize the distribution of age in our dataset and see if there's a relationship between age and income. We could create a histogram of the age variable and color the bars by income category:
- Connect to the
Adultdataset. - Right-click on the
Agemeasure and select Create > Bins... then click OK. - Place this new measure on the Columns shelf.
- Drag the generated field that counts the number of records to the Rows shelf.
- Place the
Incomedimension on the Color card.
Tableau will create an interactive histogram showing the count of records in each age group, color-coded by income level. We can quickly see in the visual below that the distribution is roughly normal. It has a peak around the mid-thirties, and higher incomes are more common in the late-thirties to early-forties age ranges.
With just a few clicks, we've gained some valuable insights into our data. And by publishing our visualization to Tableau Server or Tableau Public, we can easily share it with stakeholders across the organization.
Whether you're using Tableau, Excel, Python libraries like Matplotlib and Seaborn, or any other data visualization tool, the ability to create informative, visually appealing charts and graphs is a skill that will serve you well throughout your data analytics career. By making data visualization a key part of your workflow, you'll be able to explore your data more effectively, share your insights more clearly, and drive better business decisions.
5. Dashboards and Reports

As a data analyst, one of your responsibilities is to enable others in your organization to make data-informed decisions. By creating intuitive dashboards and insightful reports, you can make data accessible to colleagues who don’t have a technical background.
Dashboards and reports can range from a simple combination of charts and tables with date filters to sophisticated, interactive displays featuring numerous data points. Whatever the scale, the goal is to present key metrics at a glance and let users explore data to answer questions relevant to them.
While specifics differ across roles, nearly every data analyst job involves producing reports on findings and building dashboards to highlight important insights. Below is a look at how you can use Microsoft Power BI, a popular business intelligence tool, to design an engaging dashboard.
Building a Dashboard in Power BI
Let’s use the Adult dataset to create a Power BI dashboard. Here’s a basic workflow:
- Import the
Adultdataset into Power BI Desktop. - Use the Power Query Editor to clean and transform the data as needed.
- Create a new report and add visualizations such as:
- A donut chart showing the distribution of education levels
- A clustered column chart comparing average hours worked per week by occupation
- A scatter plot showing how age relates to income
- Add interactive filters for
age,education, andsex. - Arrange your visualizations and apply formatting to make the layout clear and intuitive.
- Publish your report to the Power BI service and share it with your team.
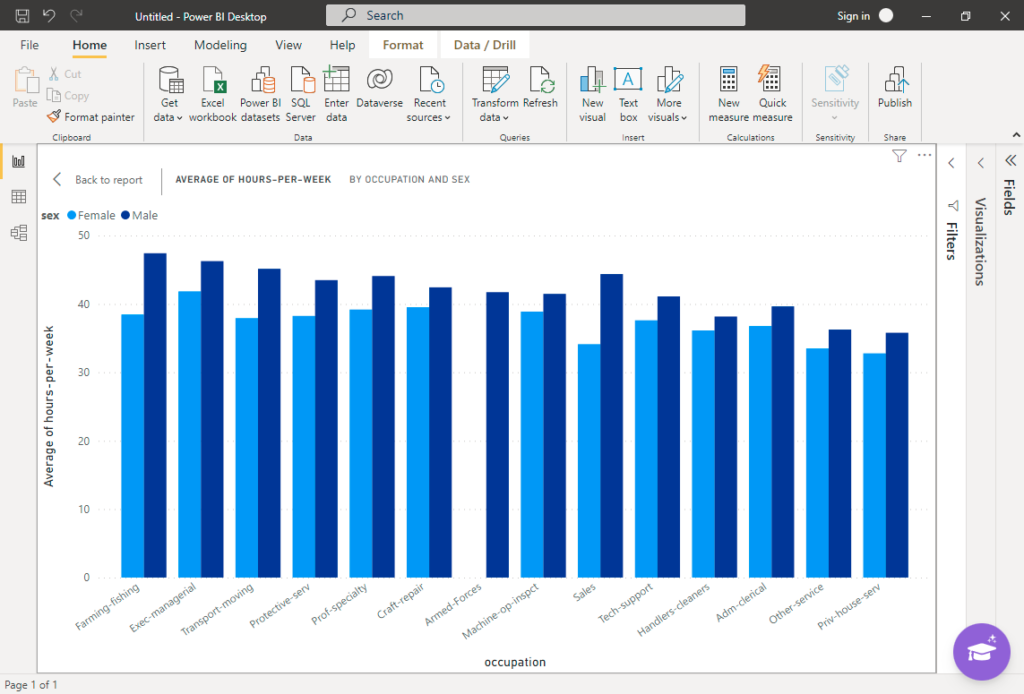
With a single-page dashboard of interconnected visualizations and filters, you enable users to explore data according to their specific concerns. HR might compare hours worked across departments, while management could analyze the relationship between age and income to guide compensation strategies.
Remember, effective dashboards strike a balance between being comprehensive and staying user-friendly. By selecting the right visualizations, labeling them clearly, and leveraging interactive features, you can support data-based decision making throughout your organization.
Building dashboards and reports is an essential aspect of a data analyst’s skill set. By using tools like Power BI, you’ll connect complex datasets to meaningful insights that can drive impactful business decisions.
6. Writing and Communication

Strong communication skills are among the skills needed for a data analyst to share insights and encourage informed decisions within an organization. From writing concise reports to talking through results with colleagues, being able to communicate in multiple formats is an essential part of this role.
Verbal Communication Skills
You’ll often collaborate with coworkers from various departments, each with different priorities and technical backgrounds. Clear speaking and active listening make those conversations productive. For instance, imagine a kickoff meeting where stakeholders describe their data needs—listening carefully and asking follow-up questions will help you truly understand the project requirements. Later, you might need to translate complex findings into simpler explanations so non-technical team members can follow along.
Written Communication Skills
Writing is equally important. You might sum up your analysis, highlight a surprising trend, or propose action steps based on data analytics skills you’ve applied. Whether you’re firing off a quick email or crafting a detailed report, the way you present your findings matters. Brief, well-structured writing can help people grasp your points faster and act on them with more confidence.

Let’s take a simple example: suppose you’re using Jupyter Notebook to analyze the Adult dataset and discover a persistent wage gap between different groups. By including clear code snippets, insightful visualizations, and a brief commentary on what you’ve uncovered, you create a narrative that others can easily digest. Combining technical evidence with plain-language summaries can motivate teams to address any issues the data uncovers.
Ultimately, even the strongest data analysis is only valuable if people understand it and see why it matters. Communication is a skill required for data analysis that can set you apart as you advance in your career. If it is new to you, explore our free project that shows you how to install Jupyter Notebook on your local machine.
7. Domain Knowledge

Domain knowledge refers to having insight into the specific industry and business context you work in. It’s what helps you interpret the data you’re analyzing and draw insights that truly matter. In other words, it’s one of the key data analytics qualifications that goes beyond pure technical ability.
For example, if you’re a data analyst at an e-commerce company, you’ll benefit from understanding online retail metrics, customer buying habits, and digital marketing strategies. Meanwhile, those working in manufacturing might focus on production workflows, supply chain dynamics, or quality control. Having this kind of background knowledge makes your analysis more relevant and actionable.
Without a strong grasp of the business context, you can miss the mark on which questions to ask or how to interpret your results. You might also have trouble explaining your findings in a way that leads to practical recommendations. Simply put, domain knowledge is part of the skills needed for a data analyst who wants to make a real impact.
Applying Domain Knowledge
Let’s imagine you’re working for a government agency that focuses on labor and employment, and you’re using the Adult dataset to explore factors affecting a person’s income. With familiarity in socioeconomic trends and labor market rules, you might hypothesize that education level and occupation are key predictors of income. To test that, you could use Python libraries like pandas for data wrangling and sklearn for machine learning:
import pandas as pd
from sklearn.linear_model import LogisticRegression

data = pd.read_csv('adult.csv')
X = pd.get_dummies(data[['education', 'occupation']])
y = (data['income'] == '>50K').astype(int)

model = LogisticRegression()
model.fit(X, y)

print(model.coef_)
This logistic regression reveals which education levels or occupations are most associated with higher income. Let’s say you find that an executive managerial role has the strongest positive correlation—a coefficient of 2.47. With both the numbers and your domain knowledge, you might recommend programs that boost training for underrepresented groups or push for more wage transparency.
Bottom Line
You can build domain expertise on the job, but it’s also wise to start learning about your industry of interest early on—through articles, conferences, or online courses. That way, you’ll stand out in interviews and step into your role with a stronger foundation. After all, combining domain knowledge with solid analytical methods is a recipe for success in any data analyst position.
8. Problem Solving

In your day-to-day work as a data analyst, you’ll run into all sorts of challenges. It might be a glitch in your code, limited resources, incomplete datasets, or tight deadlines. Having a solution-oriented mindset is one of the skills required for a data analyst to thrive.
Imagine you’re using Python to build a model that predicts whether someone earns over $50,000 a year based on the Adult dataset. During data exploration, you notice the dataset is imbalanced—fewer high earners than low earners. This imbalance can skew your model so it has trouble identifying the minority group (high earners) accurately.
Tackling Imbalanced Datasets with SMOTE
To address this issue, you could turn to Python’s machine learning libraries and apply a technique like SMOTE (Synthetic Minority Over-sampling Technique). SMOTE creates synthetic examples of the minority class to even out the dataset. It picks examples that are close in the feature space, then generates new samples at points between those examples. Here’s how you might implement SMOTE:
from imblearn.over_sampling import SMOTE
from sklearn.model_selection import train_test_split

X = data[['age', 'education', 'hours-per-week']]
X = pd.get_dummies(X, columns=['education'])
y = (data['income'] == '>50K').astype(int)

smote = SMOTE()
X_resampled, y_resampled = smote.fit_resample(X, y)

X_train, X_test, y_train, y_test = train_test_split(X_resampled, y_resampled, test_size=0.2)
By applying SMOTE, you create a more balanced dataset and give your model a better shot at recognizing the minority class. This example shows how problem-solving, paired with technical expertise, can help you overcome common roadblocks in data analytics.
Beyond technical fixes, problem-solving also means considering project constraints and coming up with creative workarounds. For instance, if your timeframe is limited, you might streamline parts of your analysis and focus on the most critical steps first. Strong problem-solving skills are among the data analytics skills required to adapt when surprises pop up.
Ultimately, each day as a data analyst brings new puzzles to solve. By staying inventive, flexible, and curious, you’ll handle the unexpected with ease—and produce valuable insights that move the needle for your organization.
Will AI Replace Data Analysts?
I’ve read quite a few articles trying to answer this question for myself, and the one that resonates with me most is: AI will not replace you, but people who use it may. It’s a humorous take, but it also highlights the real possibility that data analysts who embrace AI to automate routine tasks and broaden their skill sets will be sought after, rather than replaced.
The rapid progress of AI has sparked widespread discussions about its influence on different careers, including data analysis. There’s no doubt the role of a data analyst will evolve, but those who focus on the skills required for data analysis—like critical thinking, thoughtful interpretation, and generating insights—are likely to stay in demand. Machines can rapidly handle large datasets, but it’s the human ability to ask the right questions and connect data to strategic decisions that sets skilled analysts apart.
The Transforming Role of Data Analysts
As AI technology progresses, routine tasks like data cleaning, preprocessing, and simple analysis will gradually become automated. That means data analysts can dedicate more time to interpreting results, providing strategic recommendations, and influencing major decisions. The most valuable skills will include:
- Critical thinking and problem-solving abilities
- Creativity in approaching data challenges
- Effective communication and storytelling with data
- Strategic decision-making driven by insights
Embracing the AI Opportunity
Here’s some good news: the rise of AI is opening new doors for data analysts seeking to grow professionally. By proactively learning about AI and integrating it into your workflow, you can strengthen the skills needed for a data analyst in modern organizations.
This doesn’t mean you should abandon the core techniques you’ve already mastered. Instead, you should focus on enhancing your existing data analyst skills with tools that automate repetitive work and offer deeper analytical capabilities. The data analysts who will thrive are the ones who can connect tried-and-true methods with new AI innovations.
Why Data Analysts Should Embrace Generative AI
If you’re looking to enhance your data analyst skills, learning how to use generative AI is a smart move. By tapping into AI-driven tools, you open up new paths to working more efficiently and uncovering deeper insights. Here’s why adopting generative AI can make a big difference for any analyst who wants to stay ahead:
- Time: AI can handle a lot of those tedious, repetitive tasks that tend to soak up precious hours. Automating data cleaning or other routine processes frees you to focus on high-impact work like analyzing results and crafting action plans. As mentioned earlier, data analysts often spend a huge part of their day preparing data. Even cutting that in half with AI leaves extra bandwidth for more meaningful projects.
- Efficiency: Generative AI can sift through massive datasets and reveal patterns we might easily miss. By weaving AI into your analytical workflow, you can provide more nuanced insights that truly benefit the organization, rather than just surface-level observations.
- Opportunity: Finally, there’s the new career potential that comes from blending data analytics skills with AI. As companies roll out AI initiatives, roles like AI Ethics Officer or AI Security Specialist have emerged—positions that barely existed a short time ago. Building your expertise now can pave the way for roles that combine your data analyst skills with AI-focused responsibilities.
Launching Your Data Analyst Career
Becoming a successful data analyst takes more than just technical prowess. It calls for a broad range of data analyst skills, from data prep and exploration to strategic thinking and clear communication. In a field that’s constantly changing, learning to integrate AI into your workflow isn’t just a bonus—it’s fast becoming an essential part of the job.
By adding powerful tools like generative AI to your toolkit, you can become more efficient and level up your analytical abilities. That’s a big advantage if you’re aiming for roles that blend data analysis with AI innovation. Fortunately, expanding your expertise in these areas doesn’t have to be intimidating.
Investing in well-structured data analytics projects will help you build real-world experience and a strong portfolio—one that demonstrates you can deliver genuine business impact. You’ll be able to show employers that you’ve got the skills required for a data analyst, along with practical examples of how you’ve applied them.
If you’ve been waiting for the right moment to start your career as a data analyst, there’s no time like the present to take that step forward.