10 Data Analysis Tools For Entry-Level Analysts (2026)
You've probably opened a few data analyst job postings and closed them again. SQL, Python, Excel, Tableau, Power BI, Snowflake, and a handful of things you've never heard of, all under "requirements." It's hard to tell what you actually need to learn and what's just there.
A typical posting looks nothing like the day-to-day reality of the role. Working analysts across industries report that most requests come down to querying a database, cleaning up a spreadsheet, and putting a chart in front of a stakeholder.
Analysts and hiring managers describe that gap openly, and it's good news for you. It means the list of data analysis tools you need before your first application is much shorter than a job posting suggests. Build the right foundation first, then layer on the tools that match your target industry and role.
This guide covers the 10 data analysis tools that matter most for getting hired, organized by priority, with honest context from practitioners about what day-to-day work looks like. If you want a structured route through all of it, Dataquest's Data Analyst Career Path covers SQL, Python, and visualization in a sequence designed for exactly this kind of career entry.
Table of Contents
- Why tool choice matters less than you think
- SQL and Excel are your non-negotiable starting point
- Python is the next layer once spreadsheets and queries run out of room
- Data visualization tools: choosing between Power BI, Tableau, and Looker Studio
- Modern data stack tools and when entry-level analysts encounter them
- Where AI tools fit in your stack
- Tool stacks differ by industry
- Free data analysis tools to start learning today
- Two learning sequences that work
- Key takeaway
- Frequently Asked Questions
Why tool choice matters less than you think
Before you go down the rabbit hole of comparing tools, it helps to understand what experienced analysts actually say about them.
A hiring manager in the r/analytics community described spending half of every interview on SQL, Power BI, and Excel, including a live SQL coding exercise. They're not quizzing candidates on 12 different tools. They're evaluating depth in the fundamentals, and whether you can think through a data problem clearly.
An analyst with five years of experience put it more plainly:
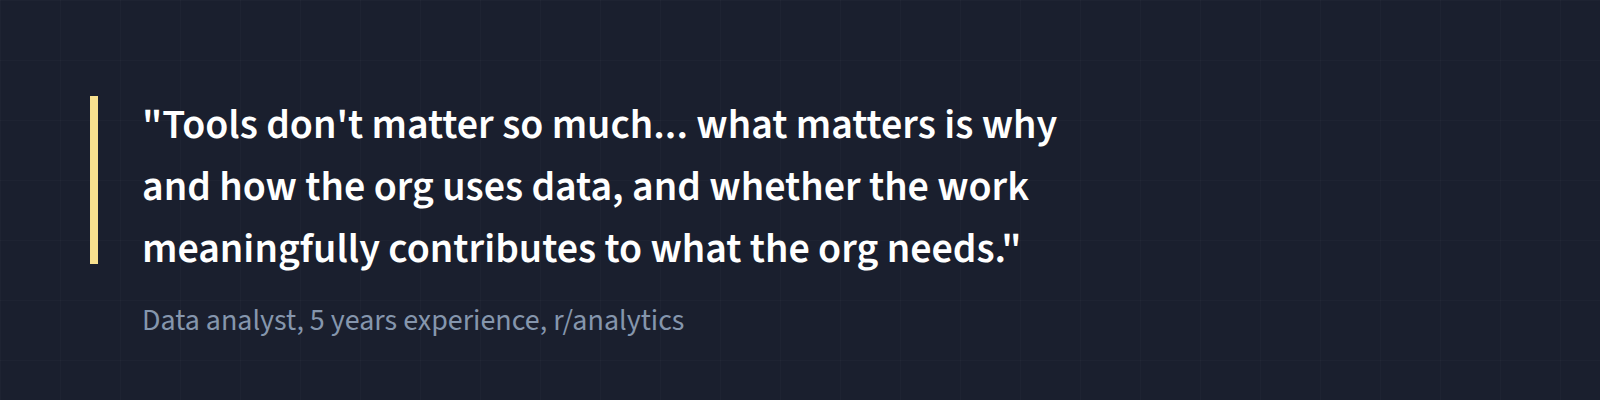
That doesn't mean tools don't matter at all. But it reframes the question. Instead of asking "which of these 20 tools should I learn?", ask "what foundation do I need, and which specific tools serve my target industry?" The answer to the second question is a much shorter list and a much more manageable learning plan.
Job descriptions also tend to overstate tool requirements. Analysts in these discussions describe postings as aspirational, with companies listing every tool the team has ever touched rather than the ones a new analyst would actually use. Seeing Power BI, Tableau, and Looker Studio all on the same job posting doesn't mean you need to be fluent in all three before applying.
SQL and Excel are your non-negotiable starting point
Ask any working data analyst what they use most, and you'll get some version of the same answer. SQL and Excel come up in nearly every response, across industries, experience levels, and company sizes. These aren't beginner tools you'll eventually grow out of. They're the daily drivers of the job.
1. SQL
SQL appears in roughly 53% of data analyst job postings, according to 365 Data Science's 2026 analysis of 855 US listings. The Stack Overflow Developer Survey 2025 found SQL used by 58.6% of respondents, making it the most widely used data tool across the profession. Every company with data has databases, and SQL is how you talk to them.
A healthcare analyst in the r/analytics community said it as clearly as anyone:
"SQL is probably the most important skill. Your reports will be infinitely cleaner and more efficient if you can write a good query." — Healthcare data analyst, r/analytics
To make that concrete, here's what a practical SQL query looks like. This pulls the top 10 customers by revenue for the current month, the kind of request that lands in an analyst's inbox regularly:
SELECT
    customer_id,
    customer_name,
    SUM(order_total) AS monthly_revenue
FROM orders
JOIN customers USING (customer_id)
WHERE DATE_TRUNC('month', order_date) = DATE_TRUNC('month', CURRENT_DATE)
GROUP BY customer_id, customer_name
ORDER BY monthly_revenue DESC
LIMIT 10;
This one query can provide a clear business answer from potentially millions of rows of data. That's the power SQL gives you, and it's why interviewers test your knowledge of it directly.
Note: SQL date functions and join syntax vary by database, so you may need small tweaks depending on the system you're using.
The core SQL syntax transfers across environments. Whether your employer uses PostgreSQL, MySQL, SQL Server, BigQuery, or Snowflake, the fundamentals stay largely consistent. Learn them once, and you can adapt to whatever platform the job uses.
That transferability is why the dialect you learn in matters less than most beginners assume. Dataquest's SQL Skills Path starts you in SQLite, which strips away server setup, user permissions, and connection strings so you can spend your first hours writing queries instead of configuring a database. From there the path takes you through window functions and complex joins, all in a browser-based environment with no local installation required.
2. Excel
Excel shows up in about half of the data analyst postings that name Microsoft Office skills, according to the same 365 Data Science analysis. Its actual usage rate is higher than any posting count suggests. It's the universal format for sharing data with non-technical stakeholders, and it shows up even at companies running modern cloud infrastructure.
PivotTables, XLOOKUP (or VLOOKUP/INDEX-MATCH), data cleaning, and basic charting cover the vast majority of what entry-level analysts are asked to do in Excel. You don't need to learn VBA before your first role. Focus on the core analytical features first. Dataquest's Excel path builds exactly those skills in a structured sequence.
Python is the next layer once spreadsheets and queries run out of room
SQL and Excel will carry you a long way, but both have a ceiling. Excel slows to a crawl past a few hundred thousand rows, and neither tool gives you a clean way to repeat the same analysis next month without redoing the clicks. A programming language is what removes both limits, and for data analysts that language is almost always Python.
3. Python
After SQL and Excel, Python is the next skill that consistently appears across practitioner recommendations. The Stack Overflow Developer Survey 2025 shows Python at 57.9% usage among developers, up seven percentage points in a single year. Among data analysts specifically, it's the tool that expands what you can do once the basics are solid.
The case for Python isn't that it replaces Excel or SQL. It's that some problems are too complex or too large to handle in either. When you're working with datasets too large for Excel, building reproducible analysis workflows, running statistical models, or preparing data for visualization, Python handles it more efficiently.
The libraries worth focusing on first are pandas for data manipulation and cleaning, NumPy for numerical operations, and Matplotlib or Seaborn for basic charting. You don't need to learn web development frameworks or anything outside the data analysis ecosystem to be job-ready.
One practitioner captured the common regret among analysts who came up through Excel and SQL alone:
"I wish I had gotten comfortable with SQL and Python at the very beginning." — Data analyst, r/analytics
That's motivation, not pressure. Jupyter Notebooks make Python approachable for data work, allowing you to run code in cells, see output immediately, and annotate your thinking alongside the analysis. Dataquest's Data Analysis and Visualization with Python path builds from the fundamentals up through pandas and real data projects.
Data visualization tools: choosing between Power BI, Tableau, and Looker Studio
Matplotlib and Seaborn will get you a long way inside a notebook, and they're the right tools when you're exploring data or preparing a figure for a report. What they don't do is give a stakeholder something they can filter and explore themselves. Once you're comfortable plotting in Python, a dedicated business intelligence tool is the natural next addition to your stack.
Power BI, Tableau, and Looker Studio all have significant market share, all appear regularly on job postings, and all are rated highly by practitioners. Gartner rates both Power BI and Tableau as Leaders in its 2026 Analytics and Business Intelligence Platforms Magic Quadrant. The question isn't which one is best. It's which one is right for your target role.
4. Power BI
Microsoft Power BI is the broadest bet for entry-level analysts. It appears in 29% of data analyst job postings (365 Data Science, 2026), which now edges out Tableau, and it integrates tightly with Excel and the Microsoft ecosystem.
If you're targeting enterprise, corporate, finance, or healthcare administration roles, or if you simply don't know your target industry yet, Power BI has the widest applicability. One practical catch is that Power BI Desktop runs on Windows only. If you're on a Mac you'll need a virtual machine, or you may prefer to start with Tableau or Looker Studio instead. Dataquest's Power BI skill path takes you from your first dashboard through DAX and data modeling.
5. Tableau
Tableau appears in 26.2% of job postings and is the visualization tool of choice in consulting, marketing analytics, and data journalism. Its visualization capabilities are widely considered the strongest of the three, and it has a large practitioner community.
Tableau Public is free but limited. Full access requires a paid Creator license at $75 per user per month billed annually, which many employers provide. If this is the direction you're heading, Dataquest's Tableau skill path covers the fundamentals through interactive dashboards.
6. Looker Studio
Looker Studio (formerly Google Data Studio) is free for individual use and deeply integrated with the Google ecosystem, including GA4, BigQuery, Google Sheets, and Google Ads. If you're targeting marketing analytics, digital analytics, or startup roles using Google Cloud, it's the most natural fit. It's less common in enterprise environments, and there's a paid Pro tier for team governance features you won't need yet.
The practical advice for all three is to pick one and learn it well. The core concepts transfer between platforms, including connecting to data sources, building calculated fields, and designing dashboards for stakeholders. Use the industry table below to guide your choice.
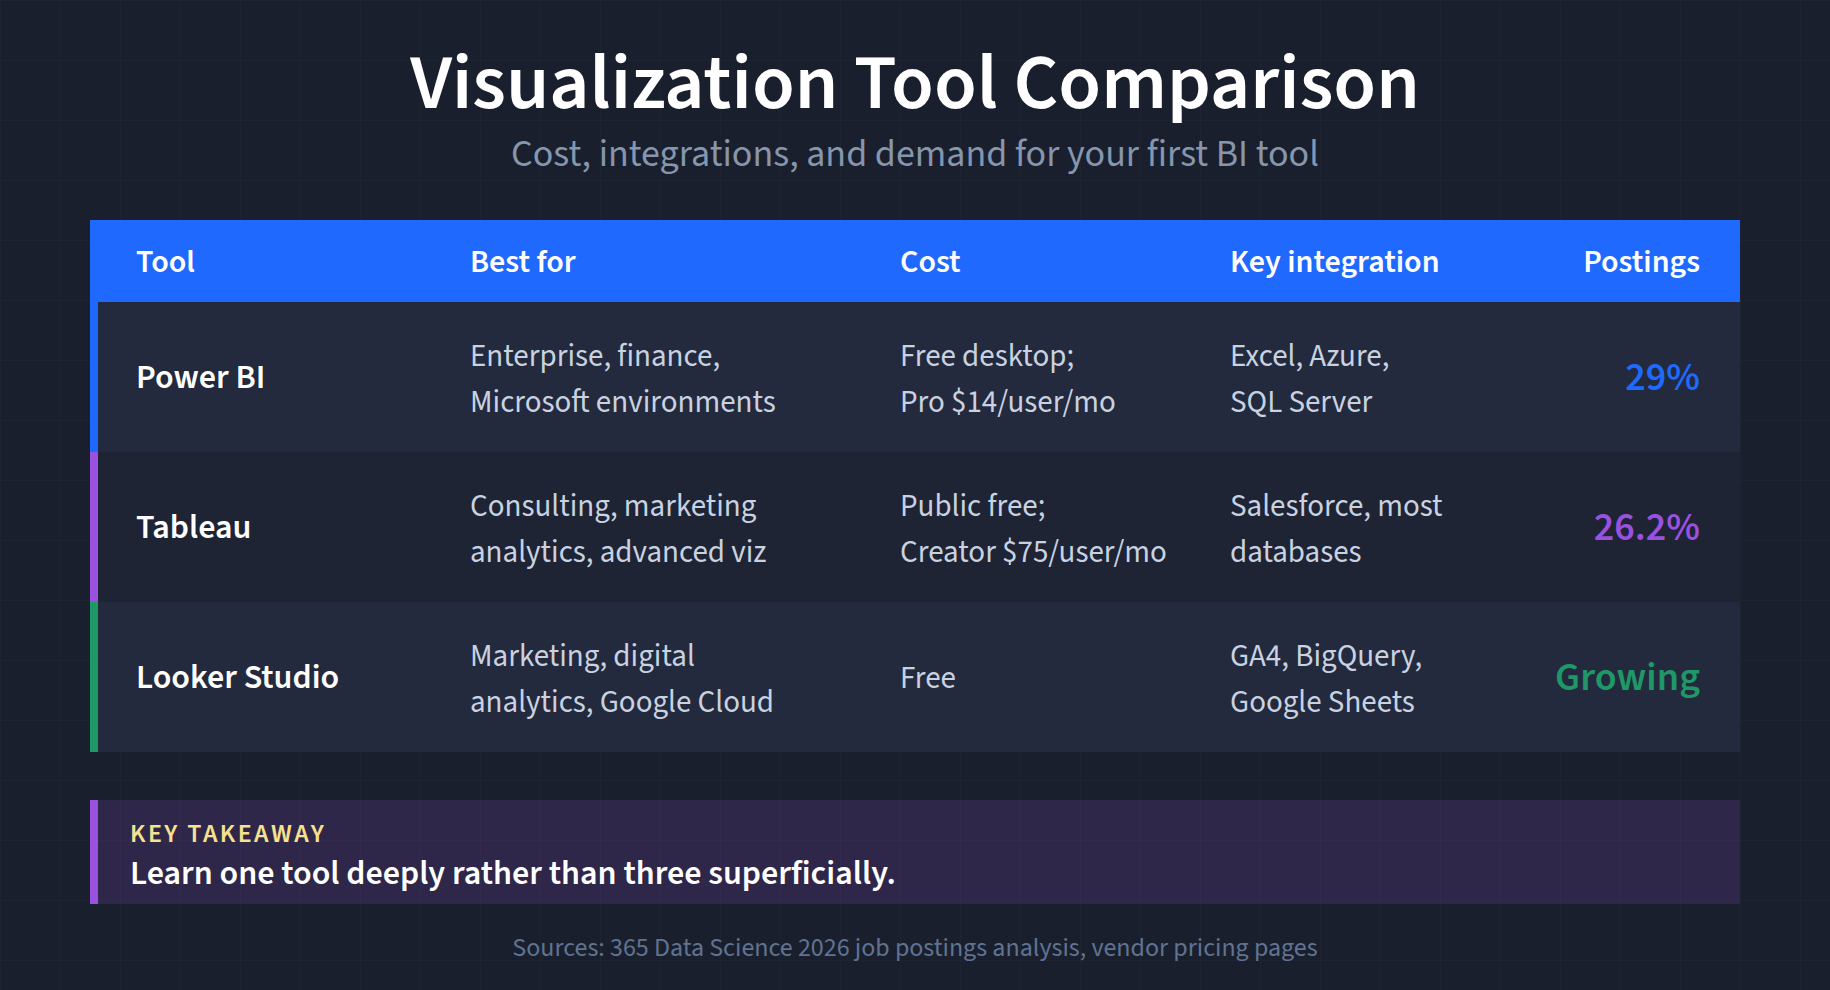
Learn one tool deeply rather than three superficially. Depth is what shows up in an interview.
Dataquest's data visualization lessons cover the fundamentals of building charts and communicating data clearly, a foundation that applies regardless of which platform you use.
Modern data stack tools and when entry-level analysts encounter them
If you've been reading job postings recently, you've likely come across terms like Snowflake, dbt, BigQuery, and Databricks. These belong to what practitioners call the "modern data stack," a group of cloud-native tools for storing, transforming, and analyzing data at scale. They appear more frequently on postings at tech companies and startups, and they come up regularly in practitioner discussions.
The key message for entry-level analysts is that you don't need these tools to land your first job. But knowing what they are helps you understand job postings, ask better questions in interviews, and show awareness of how modern analytics teams operate. All of them build on SQL, which means the foundation you're already building applies directly.
7. Snowflake
Snowflake is a cloud data warehouse, a place where companies store large volumes of data for analysis. You query it with SQL, which means if you already know SQL, you can query Snowflake. It commonly appears in healthcare, logistics, and fintech environments. Our introduction to Snowflake walks through the basics if you want a closer look.
8. Google BigQuery
BigQuery is Google's cloud data warehouse, used heavily in marketing analytics and any company running Google Cloud. Like Snowflake, it's primarily SQL-based, and its free tier covers the first 1 TiB of query data and 10 GB of storage each month, which is plenty for practice on real data.
9. dbt
dbt (data build tool) transforms data inside the warehouse using SQL. It's the "T" in the ELT pipeline that many modern analytics teams run, and it's growing quickly. Several practitioners mention picking it up on the job after being hired primarily for SQL skills, which makes it a good example of a tool you learn once you're already in the role. Our Data Transformation with dbt course covers models, testing, and deployment when you're ready for it.
One thing worth knowing before an interview: dbt Labs merged with Fivetran in June 2026, so newer job postings may reference it as part of the Fivetran platform.
10. Databricks
Databricks is a unified analytics platform built for big data and machine learning. It's more relevant to data engineers and data scientists than to entry-level analysts, though it appears in postings at larger tech organizations. If you see it on a job description, SQL and Python fluency will get you most of the way there, and our gentle introduction to Databricks in Azure is a low-commitment way to see what it looks like in practice.
Where AI tools fit in your stack
AI assistants have become part of how analysts work, and job postings increasingly mention them. They belong in this guide, but not as an eleventh tool to learn in sequence. They're a layer that sits on top of the fundamentals.
Copilot is now built into Excel and Power BI, and general-purpose assistants like ChatGPT and Claude are widely used to draft SQL, explain unfamiliar code, and speed up data cleaning. Used well, they shorten the distance between a question and a first draft of the answer.
The catch is that they're only useful if you can evaluate the output. An assistant will write you a query that runs and returns the wrong number, and you won't catch it without the SQL knowledge to read what it actually did.
Treat AI as an accelerator on skills you already have. Analysts who can write the query themselves and use an assistant to move faster are in a much stronger position than those who can only prompt.
Tool stacks differ by industry
One of the most useful things practitioner discussions reveal is that there's no universal data analyst tool stack. The right tools depend heavily on the industry you're entering, the company's existing infrastructure, and the data sources the team works with. The common thread across all of them stays the same, which is that SQL and Excel are always present.
The table below maps tool stacks to industries based on practitioner reports. Use it to align your learning with your target sector.
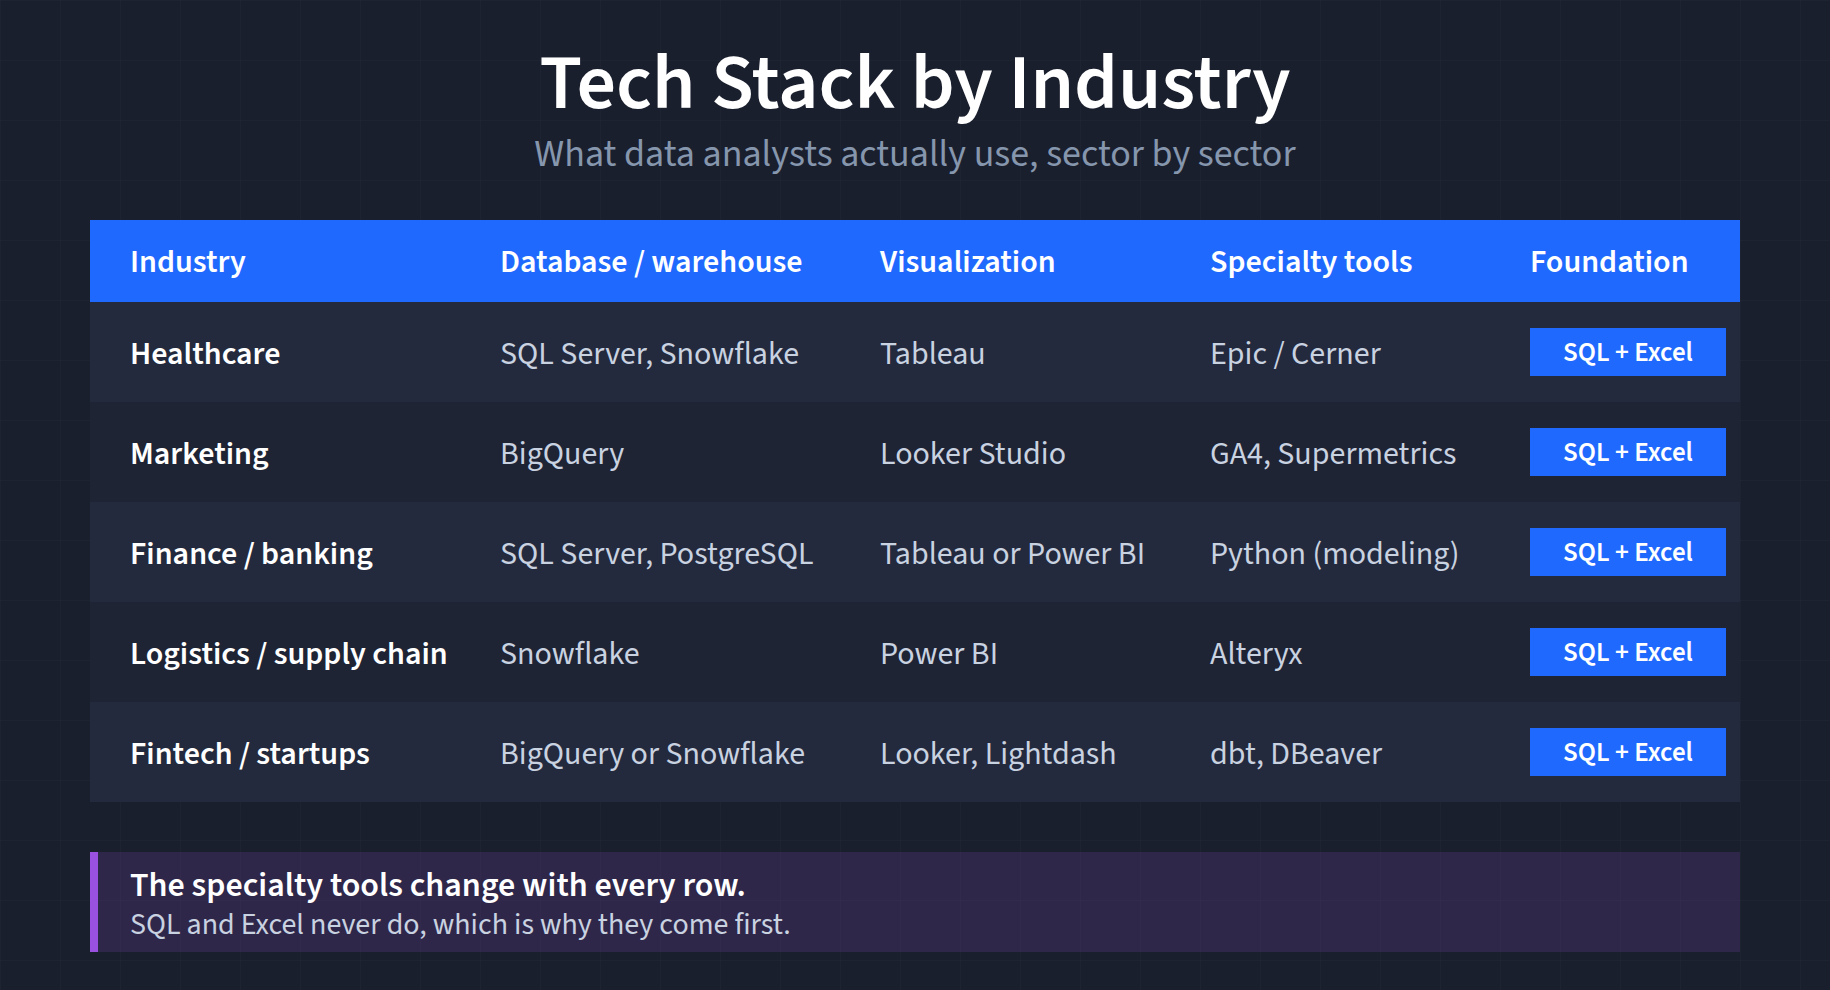
If you already know your target industry, use this table to guide your visualization and warehouse tool choices, after you've built the SQL and Excel foundation that appears in every row.
Free data analysis tools to start learning today
Cost is not a barrier to getting started with data analysis. Every tool in the foundation layer has a free version or a capable free alternative.
For SQL, you have several options that are completely free. PostgreSQL and MySQL are both open-source and widely used. Google BigQuery's free tier is enough to run real queries on real data. SQLite runs locally with no setup. Or skip the installation entirely and practice in Dataquest's browser-based SQL environment.
For Python, the Anaconda distribution installs Python along with Jupyter Notebooks, pandas, and all the key libraries in one step, free for individual learners on Mac, Windows, and Linux. Just be aware that organizations with 200 or more employees need a paid license, so check before installing it on a work machine. Google Colab is a fully browser-based alternative that requires no local installation, which makes it especially convenient if you're working on a laptop with limited permissions.
For Excel, Google Sheets covers the vast majority of what entry-level analysts need, such as PivotTables, XLOOKUP equivalents, charts, and data cleaning, all at no cost. Students with an eligible school email can get Excel in the browser free through Microsoft 365 Education, though the desktop app with full PivotTable and Power Query support requires a paid plan.
For visualization, Power BI Desktop is free on Windows. Tableau Public is free with some export limitations. Looker Studio is free and browser-based.
For practice data, Kaggle hosts hundreds of thousands of datasets across every domain, and Google Dataset Search indexes datasets from across the web. Building a portfolio project with publicly available data is one of the most effective ways to demonstrate your skills. Dataquest's data analyst projects guide walks through how to scope and present that work.
Two learning sequences that work
The mistake most people make when building data skills is trying to learn everything in parallel. A structured sequence is more effective and gets you job-ready faster.
There's more than one sequence that works, though, and the right one depends on how you like to learn and how much time you can commit up front. Both routes below end in the same place.
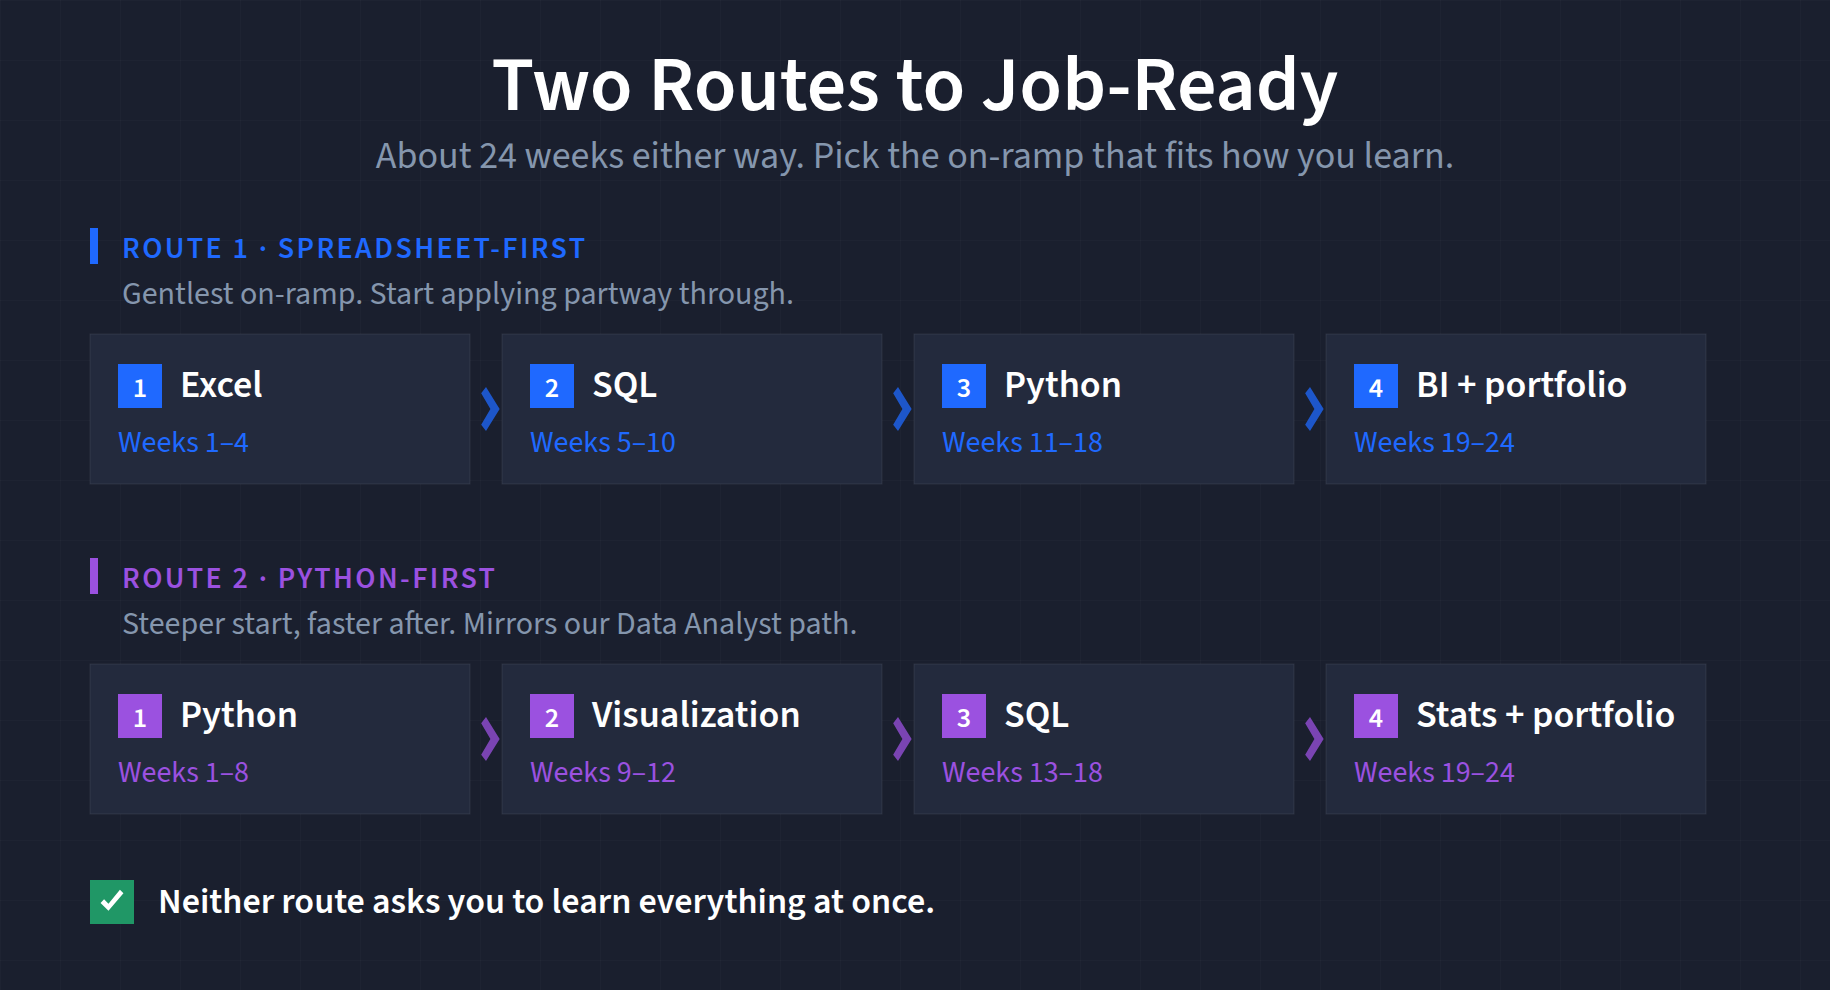
Route 1: Spreadsheet-first (Excel, then SQL, then Python)
This is the gentlest on-ramp, and it's the one we'd suggest if you're coming from a non-technical background or you want to be employable as quickly as possible.
Weeks 1 to 4, Excel: PivotTables, XLOOKUP, data cleaning, and basic charting. You already understand spreadsheets, so you're building on familiar ground rather than starting from zero.
Weeks 5 to 10, SQL: SELECT, JOIN, WHERE, GROUP BY, aggregate functions, and basic subqueries. This is where you stop being limited to whatever someone exports for you.
Weeks 11 to 18, Python: pandas for data manipulation, then Matplotlib or Seaborn for charting. By this point you understand the shape of analytical work, so Python becomes a faster way to do things you already know how to do.
Weeks 19 to 24, one visualization tool, then portfolio: Choose based on your target industry.
With strong Excel and SQL alone, you're already competitive for many entry-level roles, particularly in healthcare, finance, and operations. That's the advantage of this route, since you can start applying partway through rather than waiting until the end.
Route 2: Python-first (Python, then SQL, then visualization)
This is the sequence in Dataquest's Data Analyst in Python career path, and it asks more of you in the first few weeks. Programming fundamentals take longer to click than PivotTables do. What you get in exchange is that everything afterwards moves faster, because you're doing your cleaning, analysis, and charting in one reproducible workflow instead of three separate tools.
Weeks 1 to 8, Python fundamentals and pandas: Syntax, data structures, then pandas and NumPy for real data manipulation.
Weeks 9 to 12, visualization in Python: Matplotlib and Seaborn, plus the design principles that make a chart readable.
Weeks 13 to 18, SQL: The same fundamentals as Route 1, and they'll come quickly now that you think in terms of filtering, grouping, and joining.
Weeks 19 to 24, one BI tool, statistics, and portfolio.
Choose this route if you're reasonably comfortable with technical learning, or if you're aiming at tech, SaaS, or startup roles where Python fluency is assumed earlier.
After either route
Keep building portfolio projects that combine SQL, Python, and visualization. Get comfortable using an AI assistant to speed up your own work, and practice checking its output rather than trusting it. Familiarize yourself with cloud platforms like Snowflake or BigQuery at a conceptual level, and learn what dbt does even if you haven't used it.
Then apply. The job search takes time, and starting earlier, even before you feel fully ready, accelerates the feedback loop. For more detail, Dataquest's how to become a data analyst guide covers timelines, portfolio expectations, and job search strategy alongside the technical curriculum.
Key takeaway
Ten tools sounds like a lot until you see how they're weighted. Only three of them are things you need before your first application, which are SQL, Excel, and one visualization tool, with Python close behind as the skill that opens up the rest of the field.
The other six are tools you'll recognize on a job posting and pick up on the job. Snowflake, BigQuery, dbt, and Databricks all build on SQL, and AI assistants only help once you know enough to check their work.
Job postings overstate tool requirements, and depth in the fundamentals will carry you further than surface-level familiarity with a dozen platforms. The foundation you build now compounds over time.

Frequently Asked Questions
How long does it really take to learn data analysis tools well enough to get hired?
Most beginners can pick up SQL basics and spreadsheet fundamentals in a few weeks of consistent practice. Becoming job-ready across a core set of tools typically takes six to twelve months at 10 to 15 hours per week.
The key is focusing on one tool at a time rather than trying to learn everything simultaneously, which builds momentum without burning you out.
Will AI tools like ChatGPT replace data analysts?
AI is changing how analysts work, not eliminating the role. Tools like ChatGPT can generate SQL queries or speed up data cleaning, but they can't understand your company's business context, choose the right KPIs, or explain findings to skeptical stakeholders.
Think of AI as a powerful assistant in your toolkit. Analysts who learn to work alongside it will have a real advantage over those who ignore it.
Should I learn Python or R for data analysis?
For most beginners, Python is the stronger starting choice. It appears in 31.2% of data analyst postings compared with 24.9% for R (365 Data Science, 2026), and it's more versatile across industries.
R remains valuable in specific fields like academic research, healthcare, and biostatistics, where its statistical graphics libraries are still hard to beat for publication work.
Get comfortable with one language first, then add the other if your career path calls for it. Our R vs Python for Data Analysis comparison goes deeper on the trade-offs.
Do data analysis certifications actually help you get hired?
Certifications are excellent for structured learning, but hiring managers rarely treat them as a deciding factor on their own. The real value is in the projects you build during the certification process, which become portfolio pieces that demonstrate your skills to employers.
Treat a certification as a learning framework, and pair it with independent projects that show you can solve real problems with data. Our guide to data science portfolio projects and data analytics certification overview are good places to start.
Do I need to know every tool listed in a job posting before I apply?
No. Job postings often describe an ideal candidate, not a minimum requirement, and many long tool lists are compiled from every tool the team has ever touched.
If you meet roughly 60 to 70 percent of the requirements and feel confident in the core skills, go ahead and apply. Employers hiring for entry-level roles generally value problem-solving ability and learning potential over perfect mastery of every named tool.
How can I prove I know data analysis tools without professional experience?
Build a portfolio of three to five projects using publicly available datasets from sources like Kaggle or Google Dataset Search. Each project should walk through defining a question, cleaning the data, creating visualizations, and presenting actionable insights.
Host your work on GitHub with clear documentation. A well-explained portfolio project often carries more weight with hiring managers than a resume line listing tool names.
Do startups and large enterprises use different data analysis tools?
Yes, and the differences can shape how you prioritize your learning. Startups and small companies tend to lean on cost-effective options like Google Sheets, Looker Studio, and Python scripts, often expecting analysts to wear many hats.
Large enterprises are more likely to invest in Tableau or enterprise Looker, with Power BI dominating in Microsoft-heavy organizations. Starting with SQL, Python, and one visualization tool gives you a foundation that transfers well across company sizes.