
Data Science Course Syllabus 2026: The Right Order
The topics in a data science syllabus are pretty well settled. The order you learn them in isn't.
You've probably started learning data science before. Maybe more than once. You picked a course, worked through the first few modules, then hit a stats or machine learning chapter that assumed knowledge you didn't have. Momentum died there.
We've reviewed hundreds of courses and taught hundreds of thousands of students. There's no single formula, but some patterns hold up again and again. So let's look at what a good syllabus looks like.
One quick note before we get into the 11 stages. If you'd rather skip the trial-and-error of piecing this together yourself, our Data Scientist in Python path follows this same foundations-first logic, with real datasets and real projects built into every stage below.
Table of Contents
- Data Science Program Syllabus at a Glance
- 1. Programming: Your Foundation
- 2. Data Visualization
- 3. Data Manipulation and Cleaning
- 4. The Command Line
- 5. SQL and Databases
- 6. APIs and Web Scraping
- 7. Statistics and Probability
- 8. Machine Learning
- 9. Deep Learning and NLP
- 10. Build Something Real, Continuously
- 11. Big Data and Cloud (Later Stage, and Job Driven)
- Other Topics You'll See
- What You Actually Need to Get Started
- Data Science Career Paths and Salaries
- A Week-by-Week Path (Roughly)
- Final Thoughts
- FAQs
Data Science Program Syllabus at a Glance
| Stage | Topic | Core Tools | Where It Fits |
|---|---|---|---|
| 1 | Programming | Python | Foundation. Everything else builds on it |
| 2 | Data Visualization | Matplotlib, Seaborn, Plotly, Power BI | Builds visual instincts early, not just at the end |
| 3 | Data Manipulation & Cleaning | pandas, NumPy | Where most of your real work happens |
| 4 | The Command Line | Bash, Unix tools | Supports the stage before it, not a detour |
| 5 | SQL & Databases | SQL | A daily task once you're pulling real data |
| 6 | APIs and Web Scraping | requests, BeautifulSoup | Extends SQL to sources with no database |
| 7 | Statistics & Probability | NumPy, SciPy | Enough to interpret results, not a semester of proofs |
| 8 | Machine Learning | scikit-learn | After 1 to 7 are solid, not before |
| 9 | Deep Learning & NLP | PyTorch, TensorFlow | Specialization, not a default |
| 10 | Portfolio Projects | Git (basics) | Ongoing, not a final step |
| 11 | Big Data & Cloud | Spark, AWS/GCP/Azure, Git (advanced) | Later stage, job-driven |
1. Programming: Your Foundation
Programming isn't something to memorize before moving on. You need just enough Python to stop tripping over syntax. Two to four weeks is plenty. The rest (visualization, cleaning, SQL, modeling) you'll pick up faster once you're building with it.
Start with Python, not R
Python and R get treated as interchangeable more often than they should be. Python has the larger job-market footprint and the more active library ecosystem. It's also the language you'll use for everything downstream, including visualization, machine learning, and automation.
Learn R later if a specific job or academic field calls for it.
2. Data Visualization
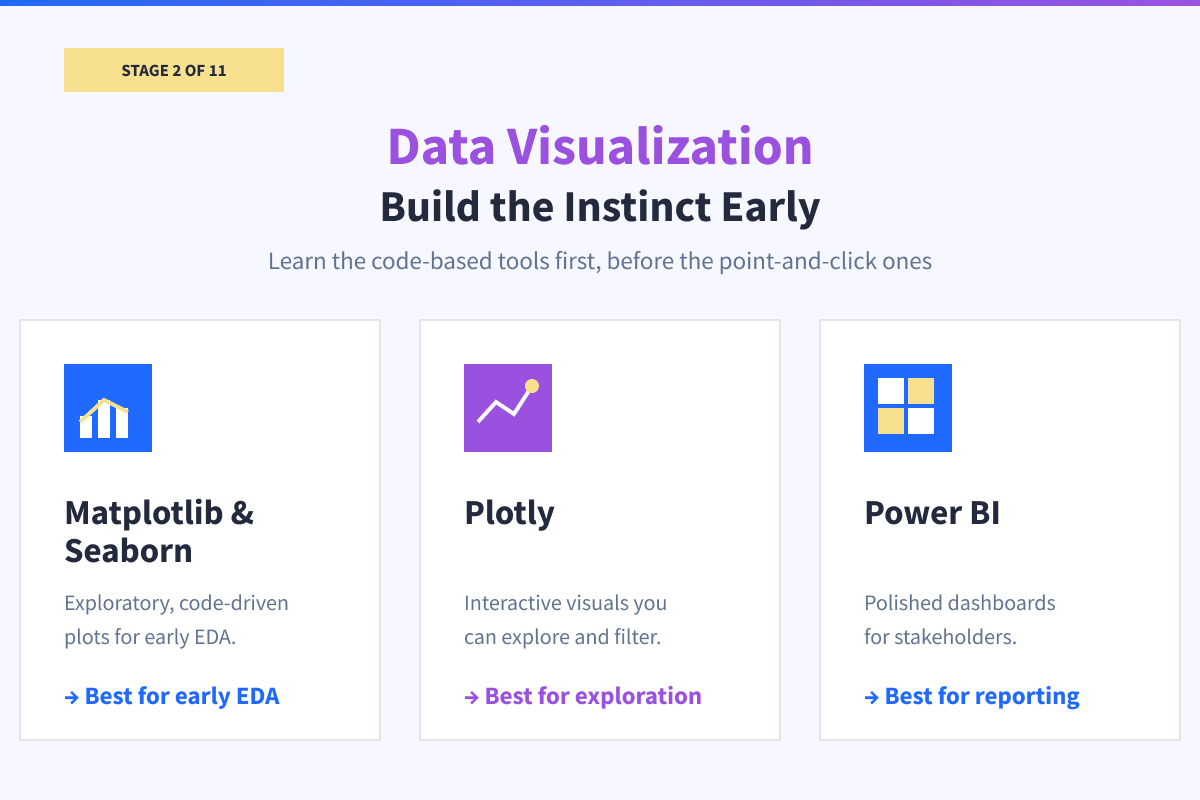
Visualization isn't a presentation skill you bolt on after the "real" analytical work is done. It goes here, after basic Python but before you're neck-deep in messy real-world data. Practicing on clean, simple datasets first teaches you what makes a chart honest versus misleading. You don't need to be fluent in pandas for this yet. Seaborn's load_dataset() function pulls in small, already-tidy datasets in a single line, as long as you're online, which is all you need to start practicing. Then, when you hit messy real-world data in the next stage, you'll already know how to check your work visually as you go.
You'll want to be comfortable with:
- Matplotlib and Seaborn for exploratory, code-driven plots while you're still working the data
- Plotly for interactive visuals
- Power BI for polished, stakeholder-facing dashboards
Learn the code-based tools first. The point-and-click BI tools will still be there later, and you'll get more out of them once you know what's actually happening under a chart that works. Starting with the drag-and-drop version can teach you to make things that look clean without teaching you why they're right.
3. Data Manipulation and Cleaning
Here's the part almost no syllabus gives real space to. It's also the part you'll spend the most time on once you're actually working, particularly cleaning and reshaping data.
Real datasets arrive messy:
- Missing values
- Inconsistent formatting
- Duplicate rows
- Columns that don't mean what their names suggest
Handling that isn't a footnote under "programming." It's a distinct skill, with its own patterns and its own common mistakes.
This is where pandas and NumPy earn their place as the two tools you'll open every single day. You'll learn to:
- Filter, merge, and reshape tables
- Handle missing and malformed data without silently corrupting your results
- Run exploratory data analysis (EDA) to understand a dataset before you draw any conclusions from it
4. The Command Line
The command line doesn't take long to learn, but it matters fast once you're working with real files instead of a single Jupyter notebook someone handed you. You'll use it to navigate directories, manage file permissions, and run scripts without opening a GUI every time.
It's also where you'll first work with piping and redirection, chaining commands together to filter and process text without writing a script for it. This isn't a deep specialization. A few focused sessions is enough to stop being intimidated by a terminal prompt. You'll keep sharpening it in the background as you move into SQL and start building your first portfolio project.
5. SQL and Databases
By this point you can write clean Python and you've learned to spot a badly-formatted column on sight. That's exactly when SQL earns its place. You'll query databases constantly once you're pulling real data instead of working from a CSV someone handed you.
This comes well before you ever touch a machine learning model. Pulling and shaping data from a database is a daily task, not a side skill.
6. APIs and Web Scraping
SQL gets you data that's already sitting in a database, neatly organized and waiting. Not every dataset works that way. A lot of real-world data lives on websites or behind an API, and you need a different set of skills to get it into a usable shape.
This is where you'll learn to make API requests, parse JSON responses, and scrape structured data out of HTML pages. You're chasing the same goal as SQL (clean, usable data) just from a different kind of source.
Treat this as a practical add-on rather than a separate discipline. You don't need to master it, you need to be able to reach for it when a project calls for data that isn't sitting in a spreadsheet or a database.
7. Statistics and Probability
By the time you get here, you've already cleaned messy datasets and pulled data with SQL. That means distributions, variance, and hypothesis tests have something concrete to attach to, instead of living purely on a whiteboard.
You need to know descriptive statistics like the mean, median, and variance, the same NumPy arrays you worked with in stage 3 now feeding straight into these calculations. You need enough inferential statistics to run and interpret hypothesis tests, which is what SciPy (specifically scipy.stats) is built for. And you need a basic understanding of probability distributions.
What you don't need is a full semester of statistical proofs before working with real data. That measures how much abstraction you can tolerate, not how well you can do the job.
8. Machine Learning
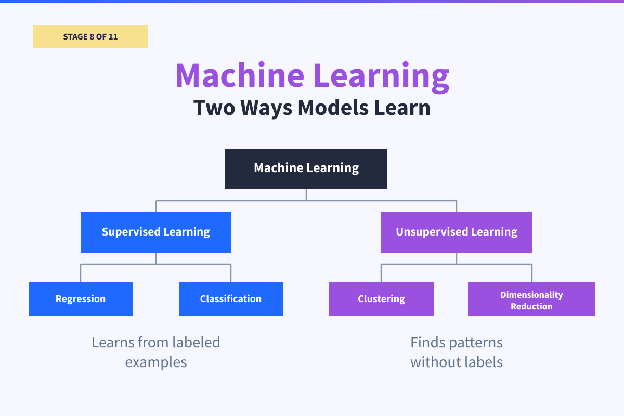
Machine learning is where most learners want to start. That's exactly why so many stall. A model is only as good as the data and judgment behind it, which is the entire reason stages one through seven come first here, not last.
Core ground to cover:
- Supervised learning: regression for continuous outputs (predicting a price, a demand number), classification for categorical outputs (churn or not, fraud or not)
- Unsupervised learning: clustering (grouping similar customers or records with no labeled answer to check against) and dimensionality reduction (cutting a dataset with hundreds of columns down to the handful that actually carry signal)
Both are built with scikit-learn. This is also where you'll first run into the ideas that separate a working model from one that only looks like it works.
You'll split data into training and test sets. You'll watch for overfitting. You'll learn to pick the right evaluation metric for the problem. Accuracy alone is close to meaningless on an imbalanced dataset. Precision and recall matter more there.
Bias and fairness aren't a side issue. This is where you'll first have to reckon with them: a live problem inside every model you build, not a footnote at the end. A biased dataset will produce a biased model unless you do something about it. That's a technical failure as much as an ethical one. There's no skipping either part.
9. Deep Learning and NLP
Deep learning deserves its own space here. The honest caveat is that most entry-level data roles don't require it.
If you're headed toward computer vision, natural language processing, or research-adjacent roles, you'll want PyTorch or TensorFlow, a working understanding of neural network architecture, and exposure to NLP techniques for working with text data.
If you're aiming at a standard data analyst or data scientist role, this can wait. Treat deep learning as a branch you take once you know which direction you're headed, not a box to check on the way to your first job.
10. Build Something Real, Continuously
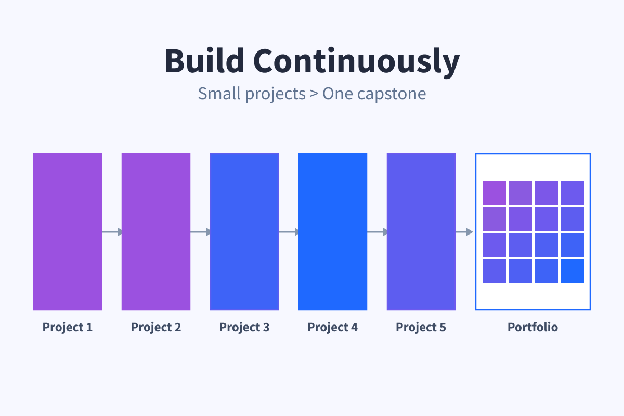
Nearly every syllabus places a "capstone project" at the very end, like a kind of graduation ceremony. That placement sends the wrong message. It suggests projects are something you do once you're already qualified, rather than how you become qualified.
Build something with real, messy data as soon as you finish stage three. Not a polished final showcase. It should be an ongoing habit.
Kaggle Datasets is a good place to start looking for raw, unpolished data of the kind your own future work will throw at you. Skip the competition datasets at first, since those are usually cleaned up before they're posted.
If you want more direction on what to actually build, we've also got articles rounding up project ideas by type, Python projects, data science projects, and others, so you're not starting from a blank page every time you want to add something new.
Pick up just enough Git to track your work as soon as project #1 starts. You don't need branching strategies yet, just commits and a repo you can point someone at.
Employers hiring for data roles look for evidence that you can work through an ambiguous problem end to end. That only shows up in a portfolio built over months, not one project assembled in the last week of a course.
11. Big Data and Cloud (Later Stage, and Job Driven)
Spark, Kafka, and cloud platforms like AWS, GCP, and Azure tend to get front-loaded, usually far earlier than you'll actually need them. (Older syllabi still lead with Hadoop, which now turns up mostly in legacy stacks.)
In practice, you'll pick these up when a specific job or dataset size demands them, not before. Most day-to-day data work, especially early in a career, happens on datasets that fit comfortably on a laptop. Learning distributed computing tools before you've needed them is time spent on infrastructure instead of on the skills that actually get you hired.
Deeper Git workflows belong in this same late stage. Basic commits are worth picking up as soon as you start your first project, but branching, collaborating on a shared repo, and resolving conflicts are worth learning once a project actually calls for them. Don't front-load the full workflow before you've written anything worth versioning.
Other Topics You'll See
A few subjects show up consistently on formal syllabi. They're worth knowing about, even though they're peripheral for most learners' first year.
- Data mining
Pattern discovery in large datasets. Overlaps heavily with machine learning - Business intelligence
Turning analysis into recurring dashboards and reports for a business - Communicating results
Presenting findings to non-technical stakeholders. A real skill worth practicing deliberately, not just absorbing by accident
None of these need dedicated months of study early on. They're worth being aware of, and worth returning to once your foundation is solid.
What You Actually Need to Get Started
A degree can open doors, particularly at larger companies with rigid screening. But it's not, on its own, the thing that makes you good at this work. A strong portfolio built on real data consistently outperforms a certificate with no evidence behind it.
Actually required:
- Basic comfort writing and reading Python
- Willingness to sit with an unclear problem before it becomes clear
- Enough math to understand what a statistical result means, not to derive it from scratch
Oversold as required:
- A computer science or math degree
- Calculus and linear algebra fluency before you start (useful eventually, not a gate)
- A stack of certifications before you apply to anything
Data Science Career Paths and Salaries
The syllabus you follow eventually points toward a specific role. The roles pay differently enough that it's worth knowing the differentiators before you commit years to one path.
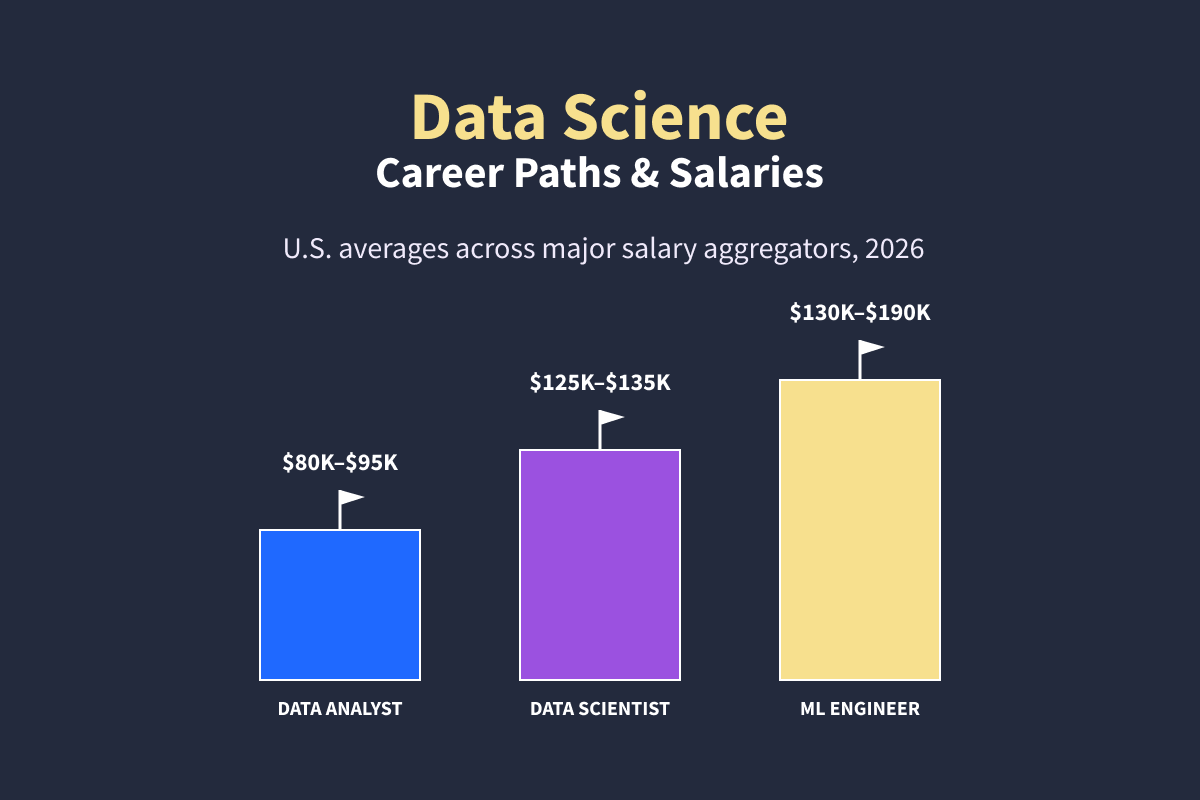
As of August 2026, U.S. averages across major salary aggregators cluster roughly as follows:
- Data analysts average around $80,000 to $95,000 in total pay (Glassdoor, ZipRecruiter). Entry-level roles commonly land in the $60,000s, though the reported range runs wider, and experienced analysts (8+ years) can clear $130,000 at the top of that experience band, based on the Glassdoor data.
- Data scientists average closer to $125,000 to $135,000 in base pay (Indeed, Built In), with a wide range depending on specialization and location.
- Machine learning engineers sit at the top of this cluster, commonly $130,000 to $190,000 in base pay (Built In). Senior roles at large tech companies run well above that once bonuses and equity are included.
Salary data moves, so re-check the source pages before you use any of it to negotiate.
Many people don't start as a data scientist. They start as a data analyst, build the foundation covered above, and move into more specialized roles within two to three years. That's a normal path, not a consolation prize.
A Week-by-Week Path (Roughly)
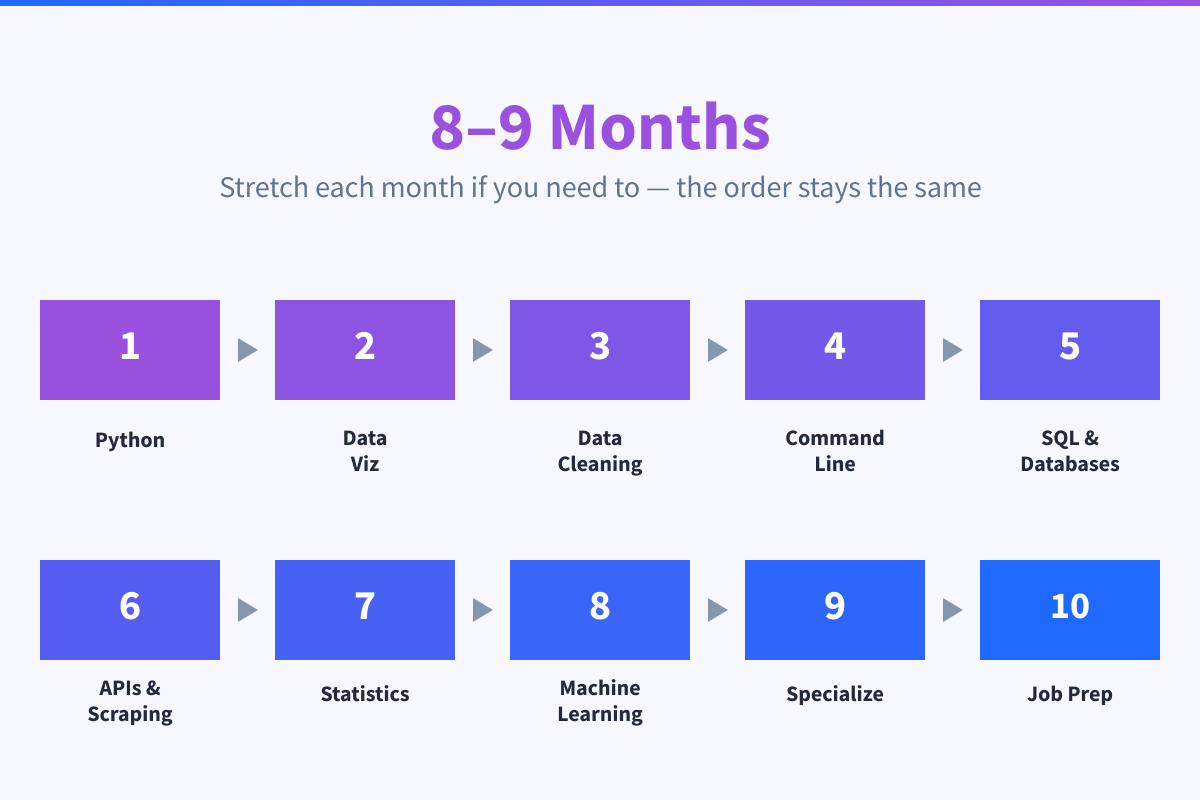
About 8 months of consistent, part-time study, weighted by how much each stage actually takes. At a lighter weekly pace, closer to nine months is normal. Stretch any stage if you need to; the order doesn't change.
Weeks 1–3: Python Programming
- Python basics: variables, loops, functions, data structures (lists, dicts)
- Writing small scripts and getting comfortable reading tracebacks
- Working in a Jupyter notebook
Weeks 4–5: Data Visualization
- Matplotlib and Seaborn for exploratory, code-driven plots
- Plotly for interactive visuals
- Spotting the usual tricks: truncated axes, cherry-picked ranges, chart types chosen to flatter the data
- Power BI basics for stakeholder-facing dashboards
Weeks 6–11: Data Manipulation and Cleaning
- pandas: filtering, merging, reshaping, groupby operations
- NumPy: array operations, vectorized calculations
- Handling missing values, duplicates, inconsistent formatting
- Exploratory data analysis (EDA) on a real dataset
- Start portfolio project #1 using a messy, real dataset (Kaggle or similar)
- Basic Git to track project #1 (commit your work, push it to GitHub)
Week 12: The Command Line
- Navigating directories, managing file permissions, running scripts from the terminal
- Piping and redirection for filtering and processing text
- Enough comfort to stop dreading a terminal prompt
- This is the lightest stage in the sequence, a few focused sessions, not a full week's work. Use the slack to keep momentum on portfolio project #1
Weeks 13–15: SQL and Databases
- SQL basics: SELECT, WHERE, JOIN, GROUP BY, ORDER BY
- Subqueries and window functions once the basics are solid
- Querying a database from Python and pulling results into pandas
- Continue portfolio project #1, pull in data from a database if you can
Weeks 16–17: APIs and Web Scraping
- Making API requests and parsing JSON responses
- Scraping structured data out of HTML pages
- Knowing when to reach for this instead of SQL
- Add a new data source to portfolio project #1, or start sourcing data for project #2
Weeks 18–20: Statistics and Probability
- Descriptive statistics: mean, median, mode, variance, standard deviation
- Basic probability and distributions
- Enough inferential statistics to run and interpret a hypothesis test
- Add a statistical claim, backed by a test, to portfolio project #1
Weeks 21–26: Machine Learning
- Supervised learning: regression, classification with scikit-learn
- Unsupervised learning: clustering, dimensionality reduction
- Training/test splits, overfitting, cross-validation
- Evaluation metrics beyond accuracy: precision, recall, F1
- Bias and fairness as a live check on every model, not an afterthought
- Finish portfolio project #1, start portfolio project #2
Weeks 27–30: Specialization or Second Project
- If deep learning/NLP is the target: neural network basics, PyTorch or TensorFlow, tokenization and text preprocessing
- If not: deepen portfolio project #2 with a harder dataset or a more ambiguous problem
- Either way, keep writing up your process, not just your results
Weeks 31–34: Big Data, Cloud, Git, and Job Prep
- Big data and cloud tools only if a target job lists them (Spark, AWS/GCP/Azure basics)
- Deeper Git and GitHub workflows for branching and collaborating on a shared repo
- Polish portfolio to two to three real projects with clear write-ups
- Practice explaining your work to a non-technical audience
- Start applying
Final Thoughts
Everything above is the order we'd teach this in, not a rulebook carved in stone. Your background, your target role, and how much time you have each week will all shift the details. The underlying logic shouldn't change. Foundations still come before specialization. Cleaning still comes before modeling. Projects still run the whole way through, instead of getting tacked on at the end.
If you'd rather follow a structured path than piece one together from scratch, our Data Scientist in Python path follows this same foundations-first logic, with real datasets and projects at every stage instead of theory up front and practice later.
And if you already know that deep learning, NLP, or another specific area is where you're headed, you don't have to sit through the general path to get there. Skill paths like Machine Learning in Python let you go deep on one area without repeating ground you've already covered. Browse our full catalog and see which path lines up with where you actually want to end up.
FAQs
What order should I learn data science in?
Start with Python, then data visualization, then data manipulation and cleaning. From there, move to the command line, SQL, and APIs before you touch statistics and machine learning. Save deep learning and big data tools for last, and build projects the whole way through rather than saving them for the end.
What is the syllabus for a data science course?
A typical syllabus covers programming (usually Python and SQL), data cleaning, visualization, statistics, machine learning, and often a final capstone project. Formal programs also include ethics, big data technologies, and sometimes deep learning. The topics are fairly consistent across schools and platforms. It's the order that varies.
Should I learn Python or R for data science?
Python. It has broader job-market demand and a larger ecosystem of libraries for data work. It also carries you through machine learning and automation in a way R generally doesn't. Learn R later if a specific role or academic field requires it.
Do I need a math degree to learn data science?
No. You need enough statistics to interpret a result correctly, and enough comfort with numbers to not be intimidated by them. A full math degree's worth of theory isn't a prerequisite. It's something some roles build toward, not something you need on day one.
Is data science still worth learning with AI tools available?
Yes, data science is worth learning. AI tools have changed how you write code. You'll lean on them for boilerplate, syntax lookup, and first-draft functions. But they haven't changed the judgment layer.
You still have to decide which question is worth asking. You still have to know whether a cleaned dataset is actually clean. You still have to catch it when a model's output is subtly wrong. And you still have to explain the result to someone who'll act on it.
If anything, AI raises the bar on that judgment, because it makes a wrong answer easier to produce and harder to spot. Someone still has to know it's wrong.
How long does it take to learn data science?
Most learners need somewhere between three and nine months, depending on pace. Full-time and focused, three to four months is realistic. Part-time and consistent, expect eight to nine months. Either way, some stages take longer than others, and that's expected, not a setback. Follow the sequence, not someone else's timeline.
