How to Write a Data Analyst Resume That Gets Interviews
Writing a resume for a job you haven't had yet is its own problem. You have to make coursework, portfolio projects and a job nobody called analytics read like analyst experience, on one page, for someone who reads resumes all day.
The raw material is usually already there. Most people underestimate how much of their existing work counts, and undersell the parts that do.
This guide covers three things: how to structure the page when you have no analyst job title, a formula for turning any of that work into a bullet a hiring manager believes, and a complete annotated example.
Table of Contents
- What Hiring Teams Look For in 2026
- How to Structure Your Resume
- The Resume Bullet Formula
- Which Skills to List on Your Data Analyst Resume
- Using Projects Instead of Experience
- Getting Past the ATS Without Gaming It
- An Entry-Level Data Analyst Resume Example
- Common Data Analyst Resume Mistakes
- Where to Go From Here
- Frequently Asked Questions
What Hiring Teams Look For in 2026
Hiring teams are working through more applications than they used to, and a growing share of those applications look polished in the same way. That changes which parts of a resume carry weight.
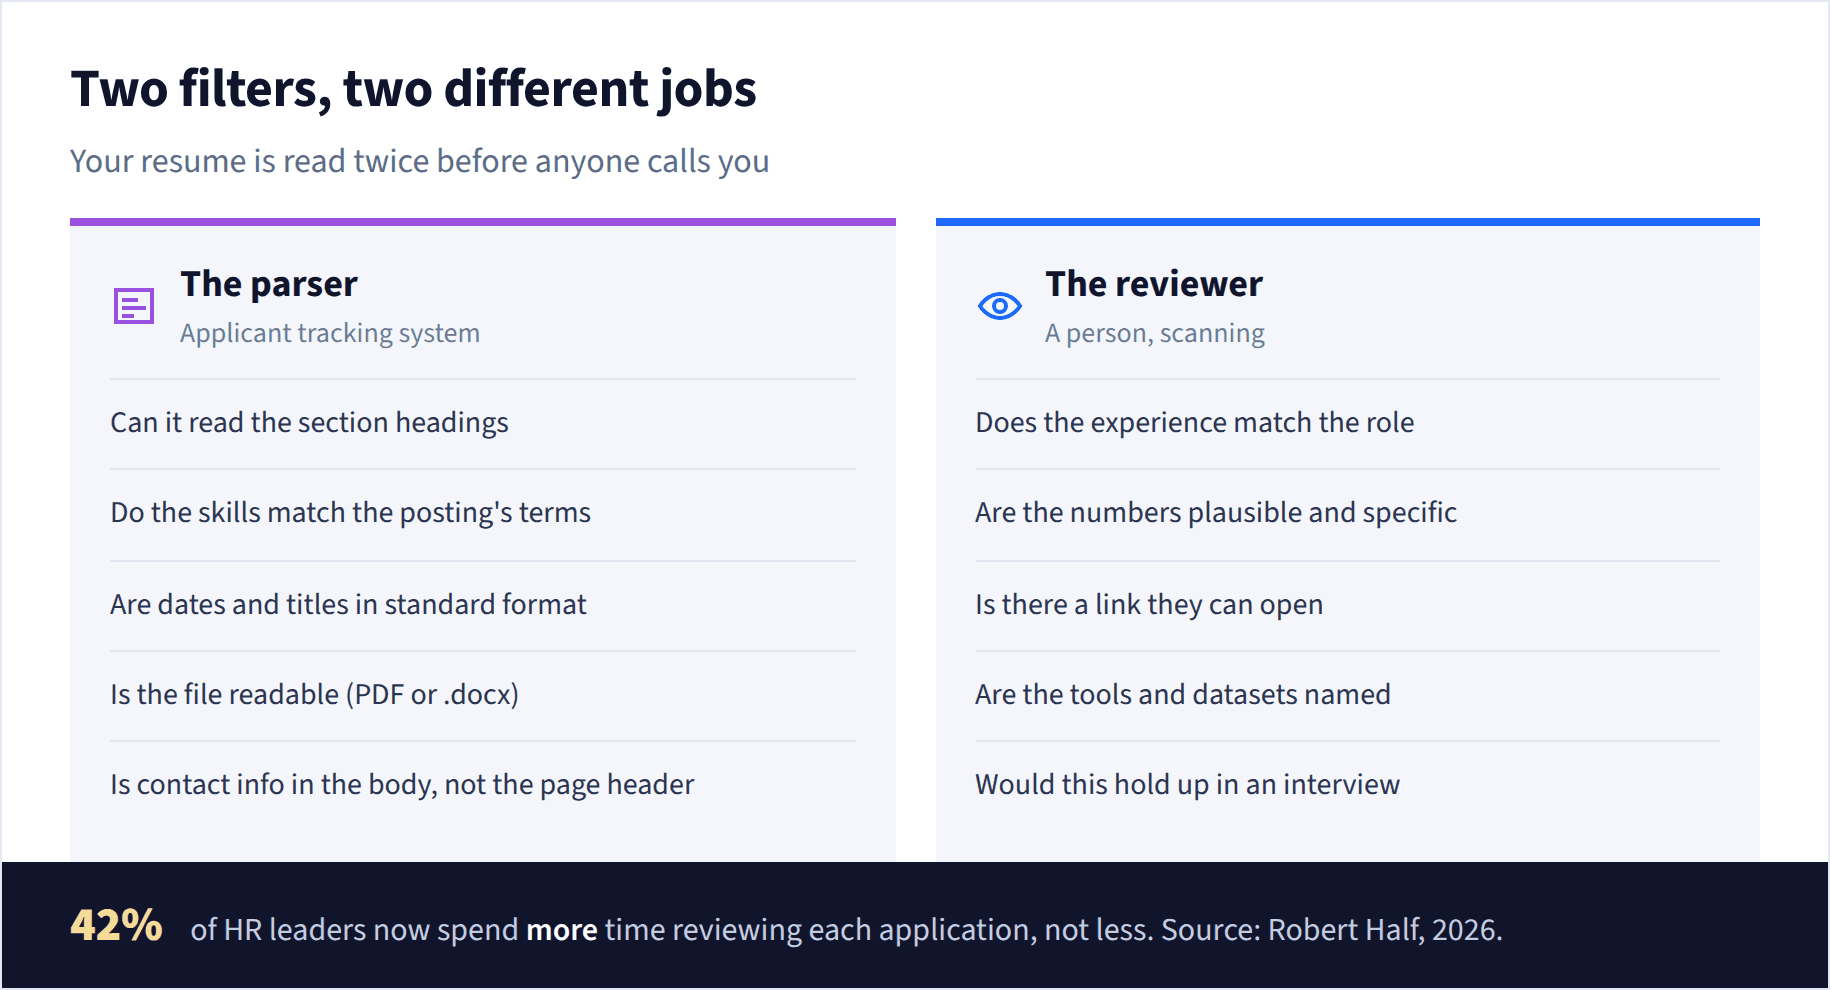
A Robert Half survey of more than 2,000 US hiring managers found that 67% of HR leaders say reviewing AI-generated applications has slowed their hiring process, and 65% of hiring managers say the surge in applications has made verifying candidate skills harder. Their response wasn't to screen faster. Approximately 42% now spend more time reviewing each application.
The survey reports what hiring teams are doing, not what they want from you, so read it as a nudge rather than a rule. The practical version is that polish alone no longer distinguishes anything, because everyone's resume has it. Named datasets, named tools, a link that opens, and numbers that survive a follow-up question are what give a reviewer something to hold onto.
Your resume passes two filters before anyone calls. The applicant tracking system (ATS) parses it into structured fields and matches keywords, then a person scans what survived.
If you're earlier in the skill-building stage, our guide on getting into data analytics from scratch covers what to learn before the resume becomes your bottleneck.
How to Structure Your Resume
Most resume advice assumes you have relevant job history to lead with. If you don't yet, the standard section order works against you.
Put your projects above your work experience. A reviewer reading top to bottom should reach evidence of analytical work before they reach three years of retail or teaching, because the first thing they're looking for is proof you can do the job.
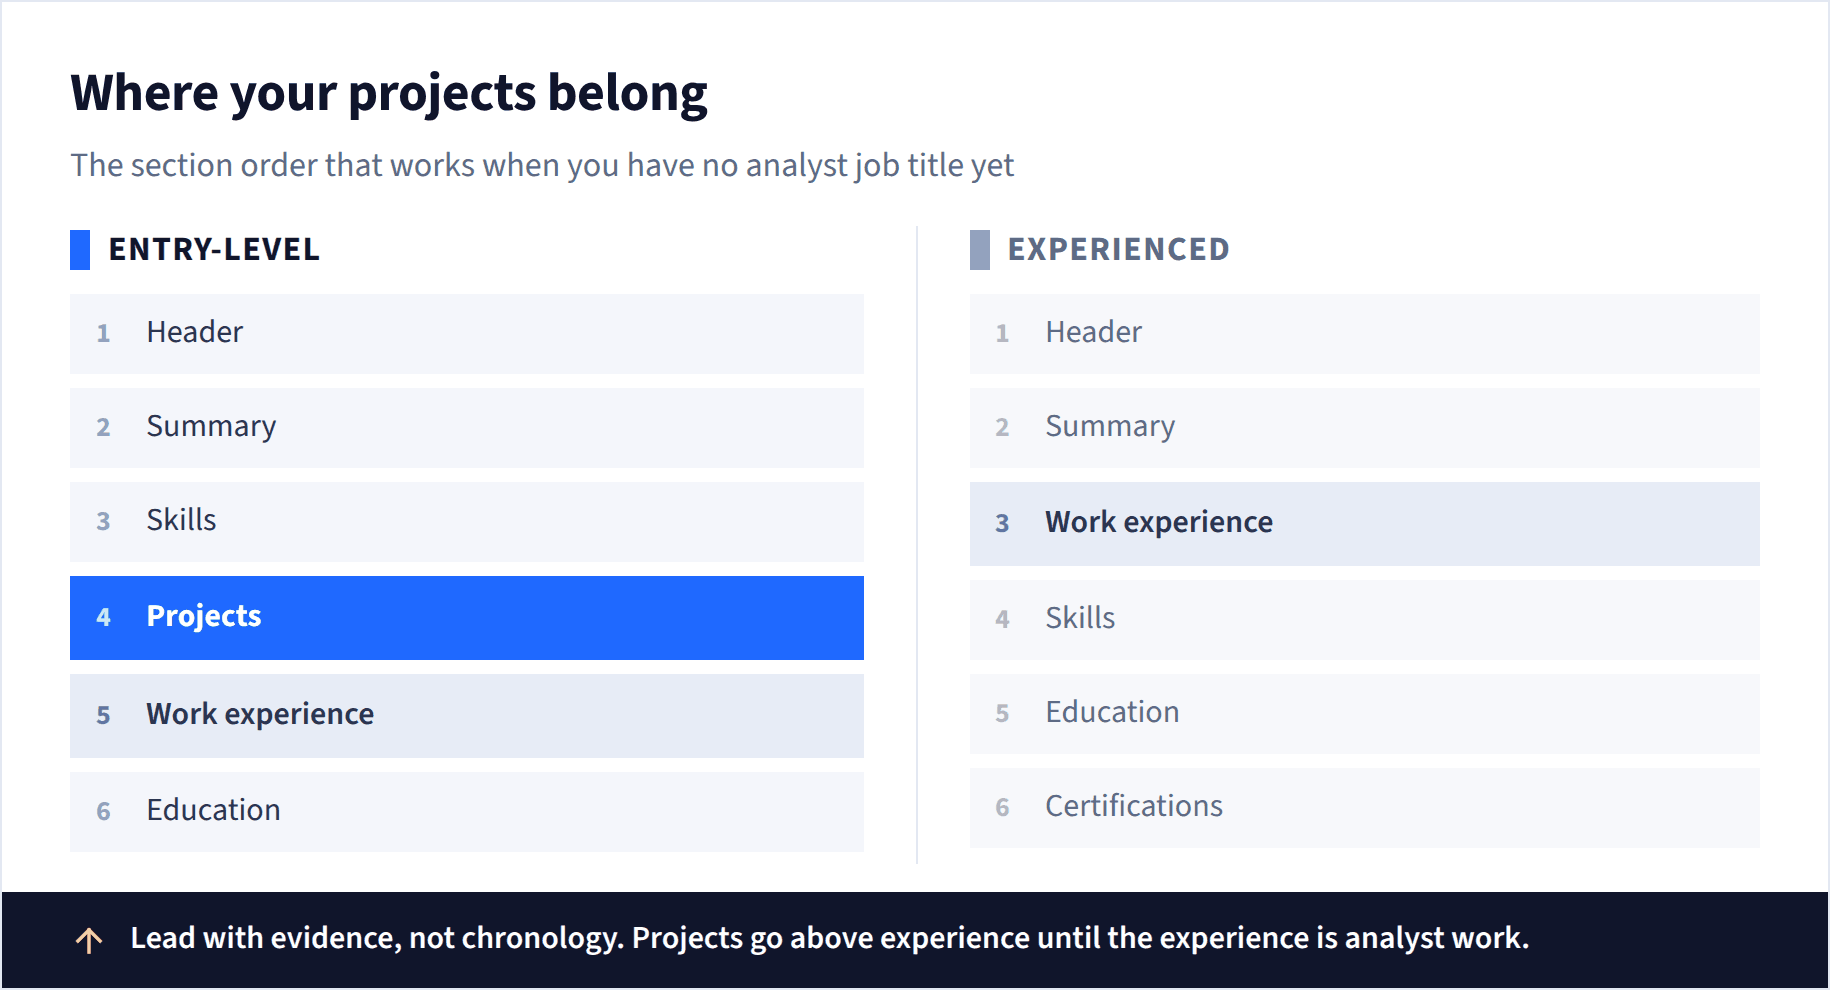
Four rules hold regardless of experience level:
- One page, in reverse-chronological order within each section.
- A single column. Two-column layouts scramble when parsed.
- Standard headings, like "Work Experience" rather than anything creative.
- PDF, unless the posting asks for a Word document. PDF holds your formatting across systems, and most modern applicant tracking systems parse it without trouble.
Write a summary, not an objective. An objective states what you want, which the reviewer already knows. A summary states what you bring, which is the thing they're trying to find out.
A workable entry-level summary names your skills, your evidence, and your target role in two or three lines.
Career changer with hands-on SQL and Python experience from six portfolio projects, including a 40M-row transit ridership analysis. Five years of retail operations experience using data to drive staffing and inventory decisions. Seeking an entry-level data analyst role.
If you're still deciding what to learn and in what order, our data analyst roadmap lays out the sequence.
The Resume Bullet Formula
This is where most entry-level resumes lose ground. People tend to write what they did rather than what happened because of what they did.
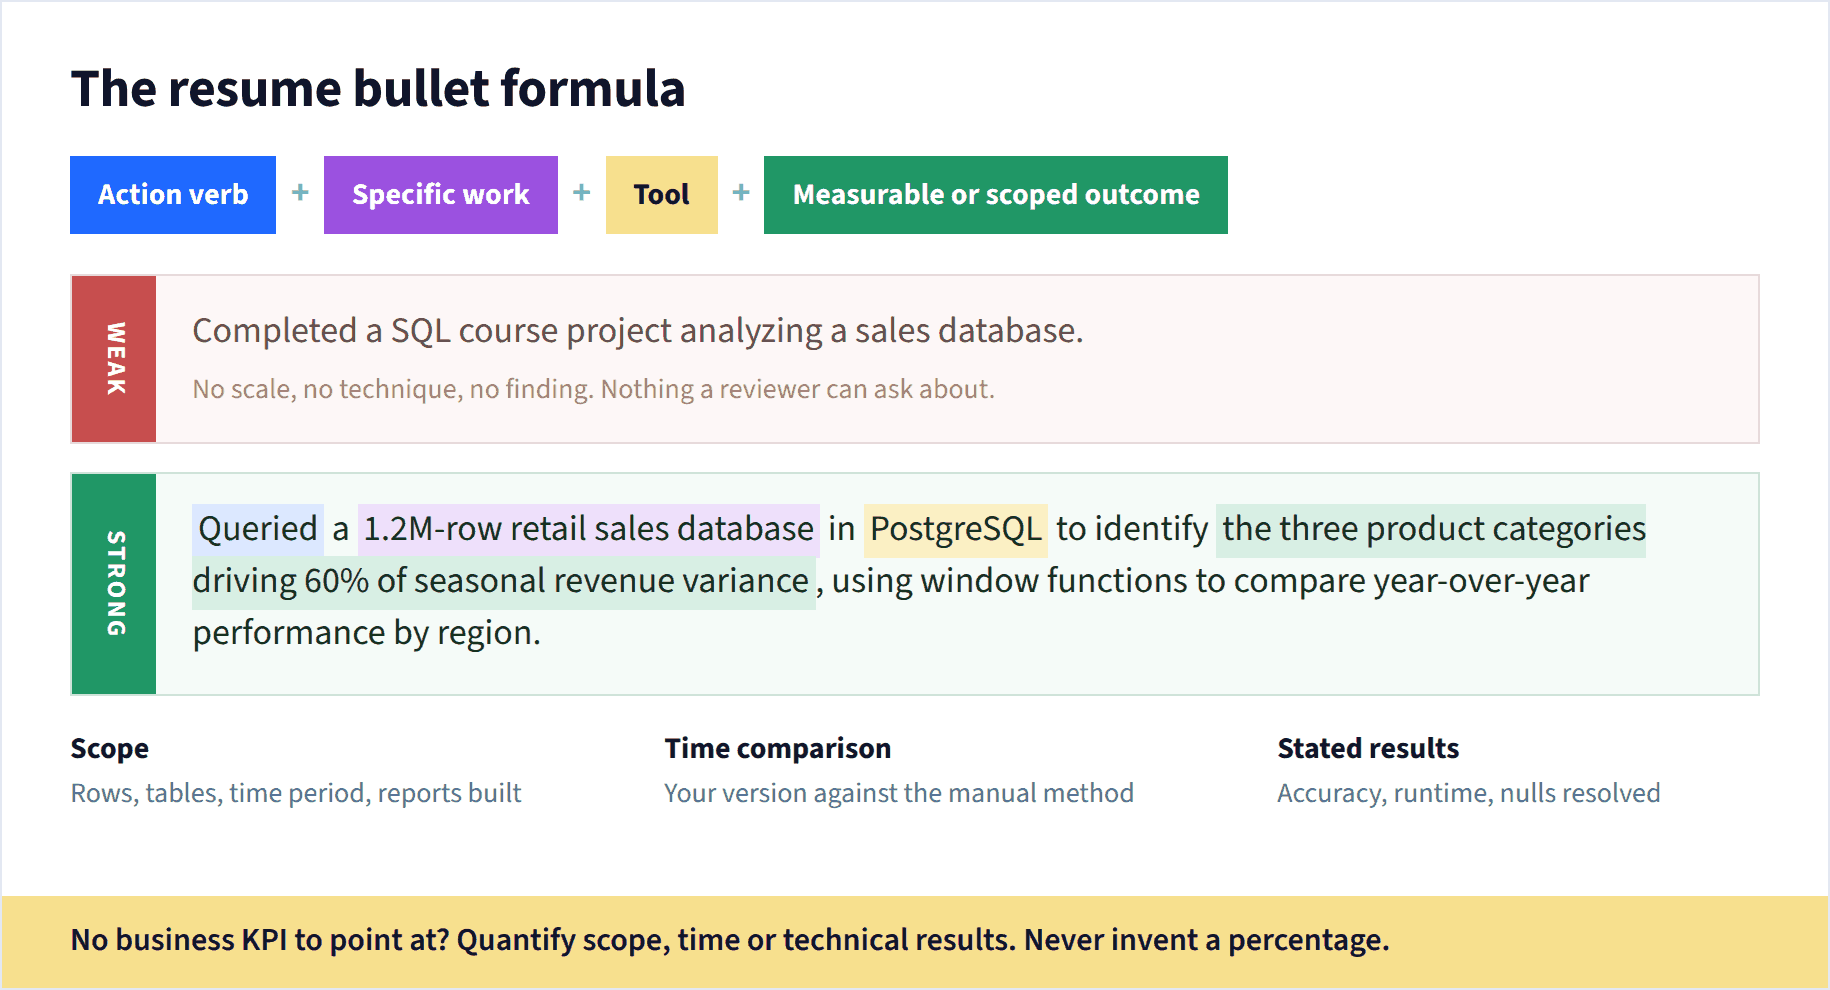
Every strong bullet on a data analyst resume follows the same four-part pattern:
- Start with an action verb.
- Describe the specific work.
- Name the tool.
- Close with a measurable or scoped outcome.
Your verb is the first thing a reviewer reads, so it should show what kind of work you did and that you did it.
| Function | Verbs to use |
|---|---|
| Analysis | analyzed, segmented, forecasted, modeled, investigated |
| Data handling | queried, cleaned, joined, validated, aggregated |
| Building | built, automated, developed, designed |
| Communication | visualized, reported, presented, documented |
Avoid "assisted with," "helped," "worked on," and "responsible for." They describe proximity to work rather than work.
Turning a guided project into a bullet
Weak: Completed a SQL course project analyzing a sales database.
Strong: Queried a 1.2M-row retail sales database in PostgreSQL to identify the three product categories driving 60% of seasonal revenue variance, using window functions to compare year-over-year performance by region.
Why it works: every point is specific. Row count, database, the actual question, the technique, and a finding. Nothing here was invented; every detail came from work that happened.
Turning a portfolio project into a bullet
Weak: Built a Power BI dashboard for a public dataset.
Strong: Built a five-page Power BI dashboard on NYC 311 service requests from 2019 to 2024 (18M records), reducing the time to answer "which complaint types spike by borough and season" from a manual spreadsheet process to a filter click.
Why it works: time saved is a legitimate metric even without a business owner. You're comparing your solution against the manual alternative, which is a real comparison you can describe.
Turning a non-analyst job into a bullet
Weak: Retail store manager responsible for scheduling and inventory.
Strong: Rebuilt weekly staffing schedules for a 22-person team using Excel pivot tables and two years of hourly foot-traffic data, cutting overtime hours by approximately 15% across two quarters.
Why it works: most jobs produce data work that nobody called data work. Scheduling, inventory, grading, patient throughput, and route planning all qualify. The bullet doesn't change what you did; it changes which part you describe.
The honest-metrics rule
Generic resume advice says to quantify everything, which pushes people toward inventing percentages. A fabricated number is the fastest way to lose an interview, because the interviewer will ask how you calculated it.
When no business KPI is attached to your work, three kinds of quantification stay honest:
- Scope. Dataset size, number of records, number of tables joined, time period covered, number of dashboards or reports produced.
- Time comparison. How long the manual version took against how long your version takes. You can measure this yourself.
- Stated technical results. Model accuracy, query runtime improvement, percentage of null values resolved, number of data quality issues found.
If a bullet has none of these available, write it without a number rather than with a fake one. A specific, unquantified bullet outperforms a quantified lie every time.
Need projects worth writing bullets about? We've collected 20 beginner-friendly data analyst projects with real datasets behind them.
Which Skills to List on Your Data Analyst Resume
Your skills section is meant to do one thing, which is to get matched against the posting without reading as a keyword dump. Grouping by category does most of that work.
The table below is job-posting vocabulary rather than a curriculum. Analyst postings vary a lot by industry, so pull your wording from the postings you're actually applying to.
| Category | What postings commonly ask for |
|---|---|
| Languages | SQL, Python (pandas, NumPy), R |
| Visualization | Tableau, Power BI, Excel (pivot tables, charts) |
| Data work | Data cleaning, Power Query, joins and aggregation, descriptive statistics |
| Workflow | Git, GitHub, Jupyter Notebook, Google Sheets |
Mirror the exact wording from the posting. Some parsers match on exact strings, so "Power BI" and "PowerBI" are not always treated as the same term. When the posting uses both a full name and an abbreviation, use both.
Apply one filter to everything on the list. Could you answer questions about it for ten minutes without stalling?
If not, it doesn't go on the resume. A tool you touched once in a lesson creates an interview question you can't answer.
Be specific about what you mean by a tool, too. "Excel" covers everything from basic formulas to pivot tables, lookups and Power Query, and an analyst posting usually means the second half of that range, so name the parts you actually use.
Skip star ratings, percentage bars, and proficiency graphics. They don't parse into anything an ATS can read, and a reviewer has no idea what your four-out-of-five in Python means.
Leave soft skills out of the skills section. "Communication" as a label proves nothing, while "presented weekly inventory findings to a 12-person store team" proves it inside a bullet where it belongs.
Place the section near the top when you're entry-level. It's the fastest way for a reviewer to decide you're worth reading, and it front-loads the terms the parser is matching against. Then tailor it per application by reordering the list so the posting's top three tools appear first.
SQL carries the most weight of anything on this list for analyst roles. If yours is shaky, our SQL Skills for Data Analysis path is five courses and three projects, covering joins, subqueries and window functions in about two months at five hours a week.
Using Projects Instead of Experience
Projects are your work experience until you have work experience. Format them that way.
Give each project a title, the tools used, a date, and two bullets, exactly like a job entry. Include three to five projects, not eight. A long list dilutes your strongest work, which is usually the first two.
NYC Transit Ridership Analysis | March 2026
Python (pandas, matplotlib), PostgreSQL, Tableau
github.com/yourusername/nyc-transit
- Analyzed approximately 40M rows of MTA Subway Hourly Ridership data (2023 to 2024) to identify the six stations with the steepest decline in weekday morning ridership
- Built an interactive Tableau dashboard mapping ridership patterns by line, hour, and borough, published with documented methodology and data sources
Link the work in the project heading, not buried at the bottom. A GitHub repository, a published Tableau or Power BI dashboard, or a portfolio page all work. Whatever you link must load, and the repository needs a README explaining the question, the data source, and what you found.
A project earns its place on your resume when it answers a real question someone might ask, uses a messy dataset that required cleaning decisions you can explain, and reaches a conclusion that supports a decision.
Pick your three to five to show range rather than repetition. One exploratory analysis, one that is mostly data cleaning, and one SQL-heavy project cover more ground than three dashboards built the same way.
The README is part of the project. A reviewer who clicks through wants the question, the data source, what you did, and what you found, in that order and in only a few paragraphs.
Leave off lesson follow-alongs you didn't modify, and leave off the Titanic and Iris datasets. Reviewers have seen thousands of both, and neither demonstrates a choice you made.
Dates matter more than people expect here. A project from this year signals current skills, so if everything on your list is eighteen months old, build one more before you apply.
Our guide on presenting your data portfolio covers the layer beneath the resume, and if your projects live in repositories, hosting your projects on GitHub walks through making them readable to someone who lands there cold.
Getting Past the ATS Without Gaming It
Applicant tracking systems get blamed for a lot of rejections they didn't cause. Formatting is one ATS problem you can control.
Use a single column and standard section headings. Keep your contact details in the body of the document rather than in your word processor's header or footer region, since some parsers skip those. The top block of the resume itself is exactly where those details belong.
Avoid text boxes, tables inside the resume itself, and graphics carrying information that appears nowhere in the text.
Name your resume file the way a recruiter would want to find it later. "Jordan-Reyes-Data-Analyst.pdf" survives a crowded downloads folder in a way that "resume-final-v4.pdf" does not.
Use standard job titles. If your official title is something like "Insights Specialist" and the work was genuinely an analyst role, write "Insights Specialist (Data Analyst)" so the match happens. Only do this where the two titles describe the same job.
"Don't get creative with the headings. Have something like 'work experience' instead of 'my journey.'" — Kishawna Peck, CEO of Womxn in Data Science, from our Data Career Masterclass
Keyword mirroring works when the keywords sit inside real bullets. Pull the terms from the posting and use them where they describe something you did. A keyword block at the bottom of the page reads as gaming to a human reviewer, which is a worse outcome than a missed match.
White-text keywords, invisible padding, and fully AI-generated filler fall into the same category. They're the pattern hiring teams built their new screening habits around.
One more thing about applying. You don't need to hit every requirement. Kishawna Peck suggests treating the first two or three requirements as the real must-haves and aiming for roughly a 60% to 70% match overall, since waiting for 100% mostly means not applying.
An Entry-Level Data Analyst Resume Example
Here's everything above applied at once, on a single page.
Jordan Reyes is fictional, a retail store manager who spent a year learning SQL and Python and built a portfolio while working full time. Every figure in the resume traces back to something the character actually did.
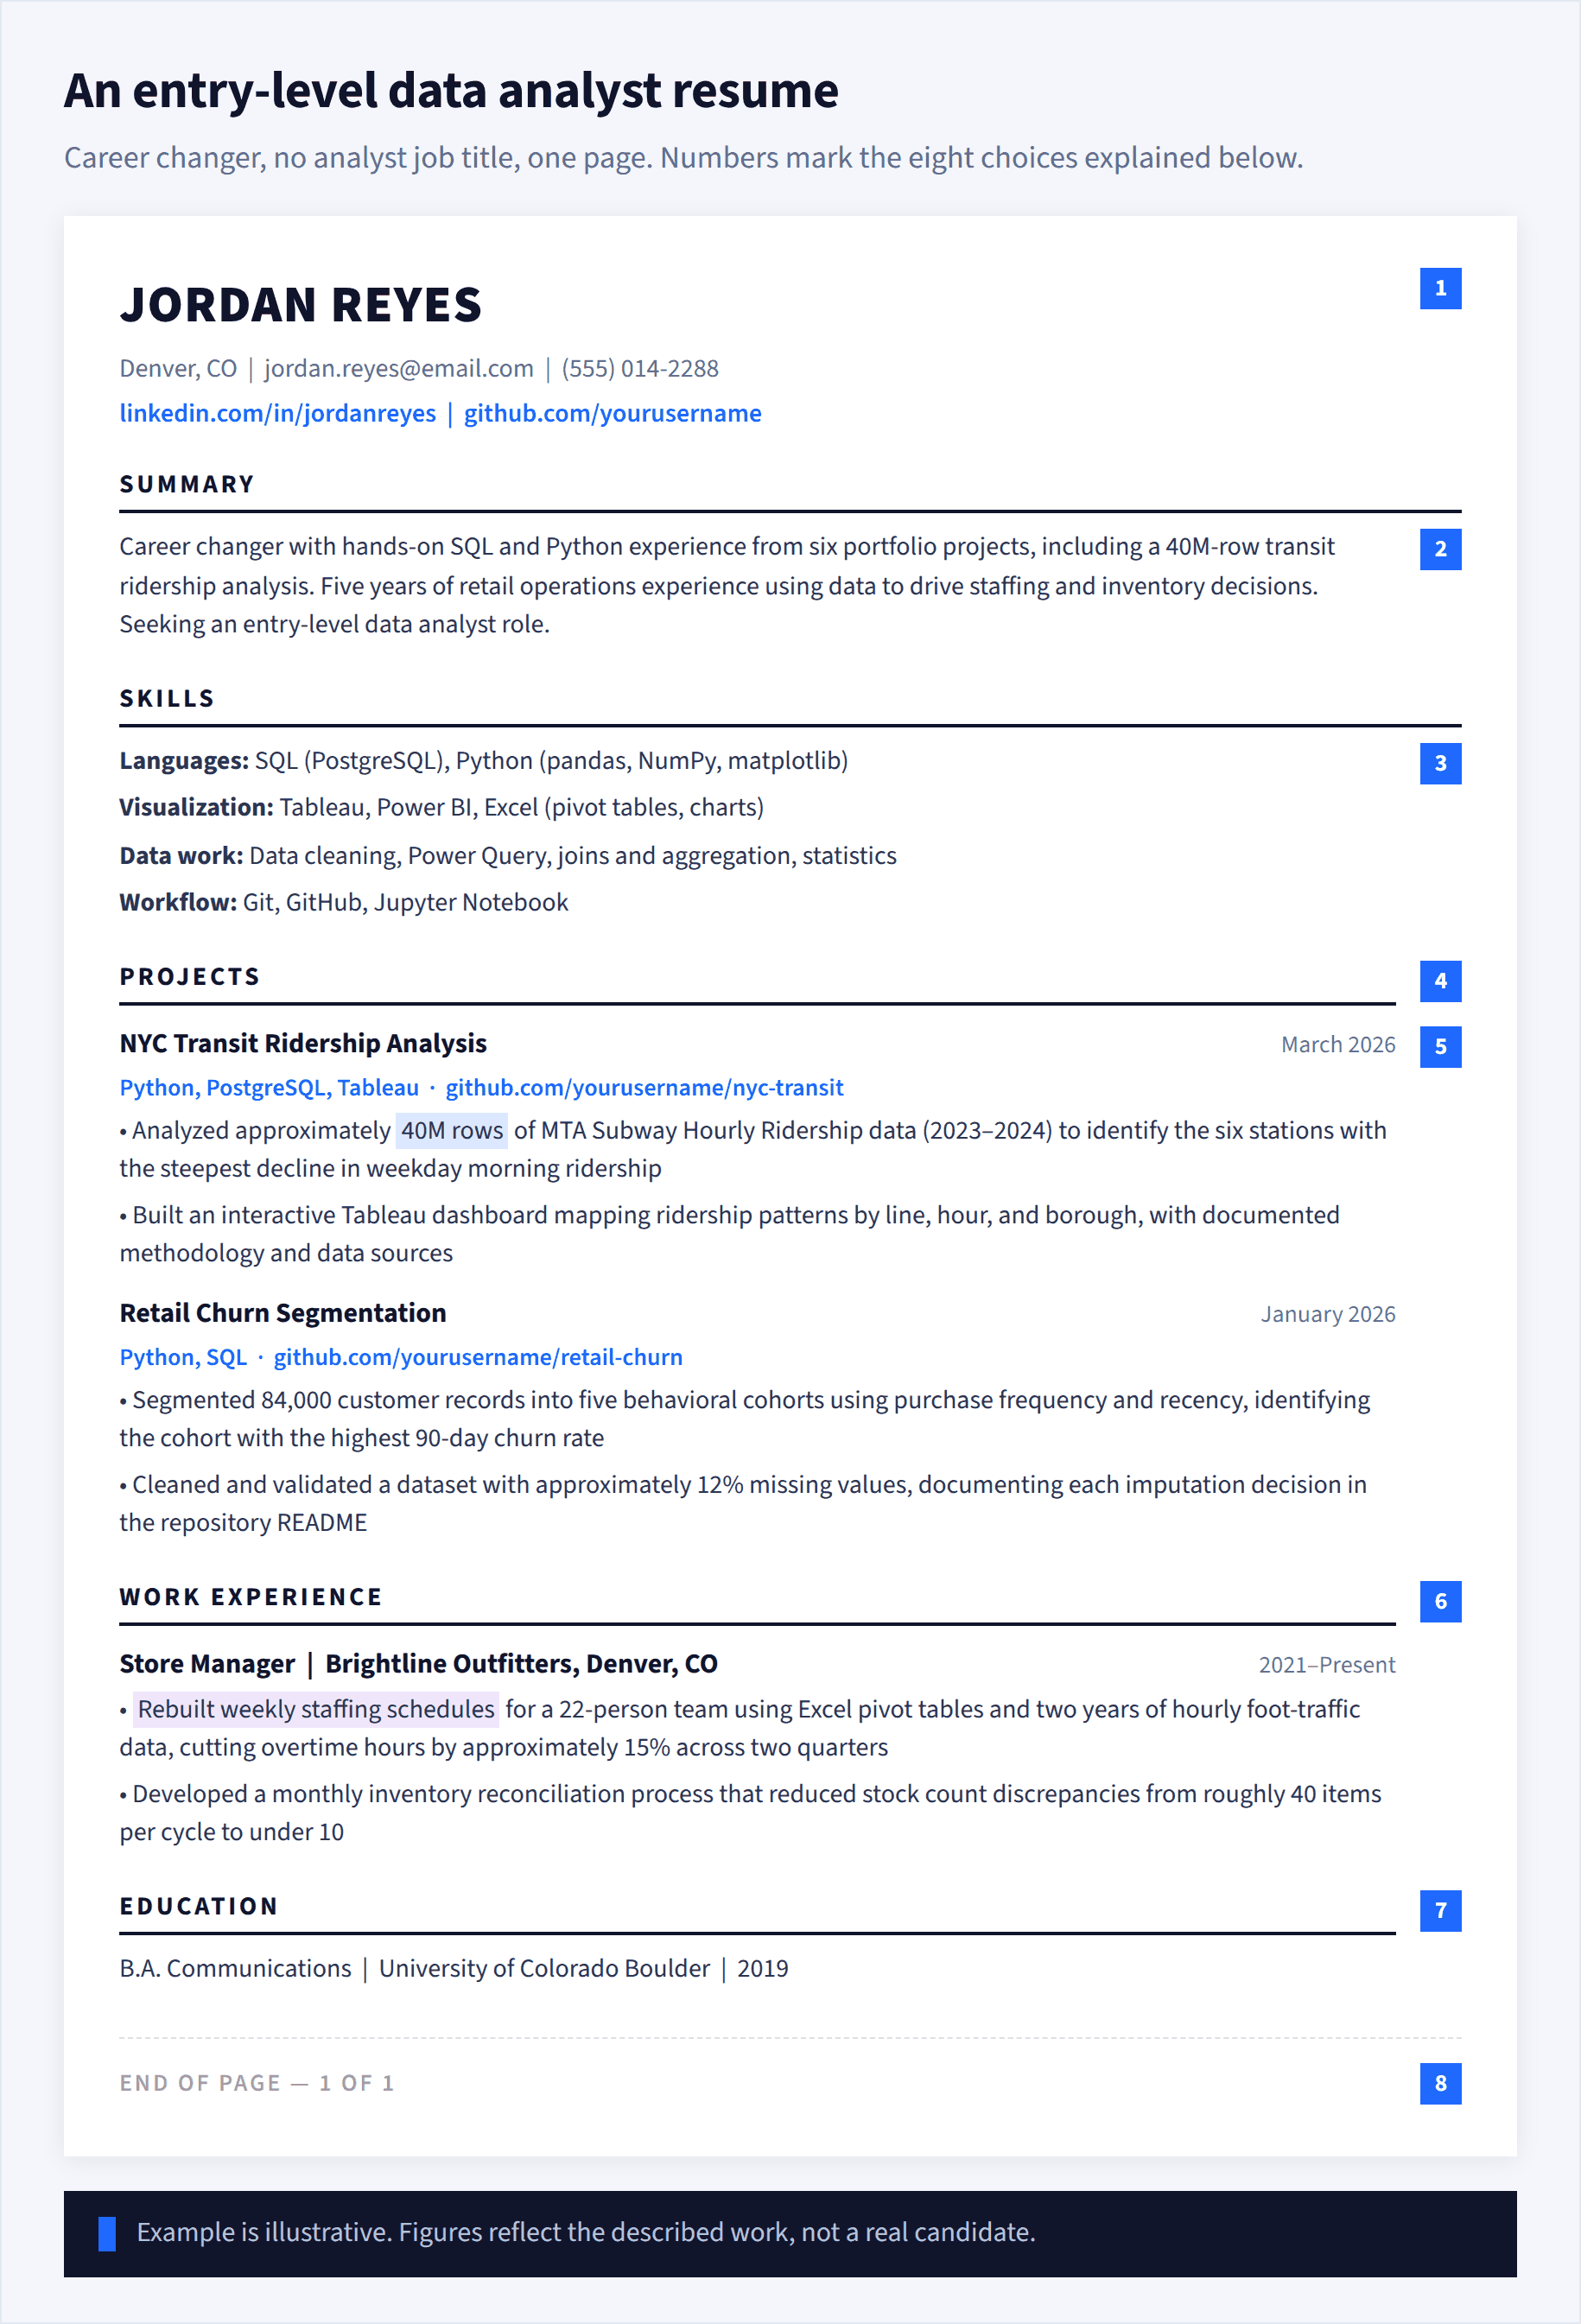
What the eight markers show
- Portfolio link in the header, next to LinkedIn. The only verification a reviewer has.
- A summary, not an objective. It names evidence rather than ambition.
- Skills grouped by category, in the posting's wording. No ratings or bars.
- Projects above work experience, formatted like job entries.
- Dataset scale as the number. No invented KPI.
- Not one job here is a data job, and every bullet is still about data work. That reframing is the highest-impact edit most career changers can make.
- Standard headings throughout. Parsers read "Work Experience", not "My Journey".
- One page, single column, reverse-chronological.
Common Data Analyst Resume Mistakes
Most rejected entry-level resumes fail on a handful of repeat offenders rather than anything exotic. Run your draft against this list before you send it anywhere.
| Cut this | Write this instead |
|---|---|
| Tools listed in the skills section that appear in no bullet | Tools named inside the bullet where you used them |
| Invented percentages you can't explain | Scope, time comparison, or no number at all |
| Two pages with zero analyst experience | One page, three to five projects |
| A portfolio link that 404s or opens an empty repository | A working link to a repository with a README |
| The same resume sent to 40 postings | Skills and summary adjusted per posting |
| "Responsible for weekly reporting" | "Built weekly inventory reports in Excel covering four categories" |
| A skill you touched once in a lesson | Skills you can discuss for ten minutes |
Your portfolio link can fail quietly, so test it in a private browser window before every application. A dead link on a resume that promises verifiable work does more damage than no link at all.
Every line on your resume is a question you've agreed to answer, so read your own draft the way a reviewer would and stop at anything you couldn't defend out loud.
Where to Go From Here
Your resume can only present work you've actually done. If your bullets feel thin after applying the formula, that's useful information, and the fix is another project rather than better wording.
Start with the structure, write your bullets using the action verb, tool, and outcome pattern, and make sure every claim points at something a reviewer can open and check.
If the projects section is the thin part, our Junior Data Analyst path is the beginner starting point: 19 courses and 15 projects covering Excel, SQL, and Python, designed to take about five months at five hours a week. If you'd rather go deeper on Python and want command line, APIs, statistics and Git alongside it, the Data Analyst in Python path covers 27 courses and 19 projects over roughly eight months at the same pace. Either way you finish with projects worth putting on the page.
Once the resume starts producing calls, the questions on it are the ones you'll be asked. Our list of common data analyst interview questions is the next thing worth working through.
Frequently Asked Questions
How long should my resume be?
One page if you're entry-level, and for most people with under eight years of experience. If you're over, cut in this order: jobs more than ten years old, bullets describing routine duties, the fourth and fifth bullet on any single role, and coursework listings once you have projects.
Do I really need a portfolio link on my resume?
For entry-level roles, yes. It's often the only verification a hiring team has that your projects exist. Put it in the header alongside your LinkedIn rather than at the bottom, and make sure the landing page shows work rather than an empty profile.
Should I use a resume template or build my own?
Templates are fine if they're single-column with standard headings. The graphic-heavy designer templates that look impressive in a preview are the ones that break parsing, because they rely on text boxes and columns. A plain document you control is the safer choice.
Can I list a certification I haven't finished?
Yes, marked clearly as "in progress" with an expected completion date. Never format an unfinished credential to look complete. It's a small thing that costs you all your credibility when it surfaces.
Do I need a cover letter too?
It rarely hurts, and it matters most if you're changing careers. A short letter is the one place you can explain why you moved from nursing or teaching into analytics, which a resume can only imply. Keep it to three paragraphs.
Is it okay if I use AI to write my resume?
Use it to edit, not to generate. AI is good at tightening a bullet you wrote and bad at inventing the specifics that make a bullet credible, and those invented specifics are what reviewers are now screening for. Write the substance yourself, then use AI to cut words.
What will I actually earn starting out?
Entry-level data analysts in the US average approximately $85,700, with a typical range of $67,000 to $112,000, according to Glassdoor data from mid-2026 cited in our data analyst roadmap. Figures vary widely by metro area and industry, and the Bureau of Labor Statistics doesn't publish a standalone "data analyst" category, so treat any national number as a rough guide and check current postings where you live.