Querying Databases with SQL and Python
Imagine having a versatile tool for data analysis - a Swiss Army knife that can handle almost any data challenge. That's what integrating SQL and Python feels like. I discovered this powerful combination a few years into my data career, and it's a key part of my data analysis process.
Initially, I used SQL with R, which was effective and allowed me to wrangle and visualize my SQL data in R. As I began using Python, I realized its flexibility in data manipulation and visualization also complemented SQL's robust data querying capabilities, like I'd experienced with R. And that's what I'd like to discuss today, querying SQL in Python.
This integration is a powerful approach for data analysis, and it's not just a personal preference. SQL excels at managing and querying large datasets efficiently, while Python offers a rich ecosystem of libraries for advanced analysis and visualization. Together, they form a comprehensive toolkit that can tackle complex data challenges.
At Dataquest, we use this integration daily. For example, we extract data on student progress from our databases using SQL, then analyze trends and create visualizations with Python's pandas library. This approach allows us to quickly identify areas where students might be struggling and make informed decisions to improve our curriculum.
You might be thinking, "Learning two languages sounds complicated." I had the same concern initially. But here's the thing: SQL and Python complement each other beautifully. SQL's straightforward syntax for data querying pairs naturally with Python's intuitive approach to data manipulation. You can practice and prototype your SQL-Python integration skills using tools like SQLite, without setting up a complex database system.
This integration opens up new possibilities in data analysis. You can handle larger datasets more efficiently, automate repetitive tasks, and create more sophisticated analyses. For instance, you might use SQL to extract time-series data from a database, then use Python's powerful libraries for predictive modeling.
In this tutorial, we'll explore how to query SQL databases directly from Python. Whether you're just starting out in data analysis or you're a seasoned professional looking to expand your toolkit, you'll find practical tips and insights to enhance your skills.
Let's start by connecting to a SQLite database using Python, the first step in combining these two essential data tools.
Lesson 1 – Querying Databases with SQL and Python

When I started using SQL and Python together in my data analysis work, I realized the potential of this combination. Today, I use it frequently at Dataquest, and I'd like to share how it works with you.
To get started, let's cover the basics. To query a database using Python, we first need to establish a connection. We use the sqlite3 library for this:
import sqlite3

# Connect to the SQLite database
conn = sqlite3.connect('world_population.db')

# Close the connection
conn.close()
This code opens a connection to our 'world_population.db' database. Always remember to close the connection when you're done to avoid potential issues with data corruption.
You can find the original dataset here.
Once we're connected, we can start asking questions (or querying, in data terms). We'll use Python's pandas library to interact with our database:
import sqlite3
import pandas as pd

# Connect to the SQLite database
conn = sqlite3.connect('world_population.db')

# Execute a SELECT query
query = ('SELECT CountryName, Population FROM population WHERE Year=2020 LIMIT 10;')
results = pd.read_sql_query(query,conn)

# Print the results
print(results)

# Close the database connection
conn.close()
And here are the results:
| CountryName | Population |
|---|---|
| Afghanistan | 38972.230 |
| Albania | 2866.848 |
| Algeria | 43451.666 |
| American Samoa | 46.189 |
| Andorra | 77.700 |
| Angola | 33428.486 |
| Anguilla | 15.585 |
| Antigua and Barbuda | 92.664 |
| Argentina | 45036.032 |
| Armenia | 2805.608 |
Let's break down this query process:
- We import the necessary libraries:
sqlite3for database connection andpandasfor data manipulation. - We establish a connection to our database.
- We create a SQL query string. In this case, we're selecting the country name and population for the year 2020, limited to 10 results.
- We use
pd.read_sql_query()to execute our query and store the results in a pandas DataFrame. - Finally, we print the results and close our database connection.
This process allows us to seamlessly transition from SQL data retrieval to Python data analysis.
Lesson 2 – Creating Data Visualizations

We can take this data and create visualizations, all within Python. For example:
import sqlite3
import pandas as pd
import matplotlib.pyplot as plt

# Connect to the SQLite database
conn = sqlite3.connect('world_population.db')

# Execute a SELECT query
query = """
   SELECT Year, Population
     FROM population
    WHERE CountryName = 'United States of America';
    """

# Retrieve the results of the query as a pandas dataframe
data = pd.read_sql_query(query, conn)

# Create a column chart of the population data for the country by year
plt.bar(data['Year'], data['Population'])
plt.xlabel('Year')
plt.ylabel('Population')
plt.title('Population of the United States of America by Year')

# Show the plot
plt.show()

# Close the database connection
conn.close()
Let's take a closer look at the visualization process:
- We start by importing
matplotlib.pyplotfor creating our visualizations. - We write a SQL query to retrieve population data for the United States across all available years.
- We execute this query and store the results in a pandas DataFrame using
pd.read_sql_query(). - We use
plt.bar()to create a column chart, with years on the x-axis and population on the y-axis. - We add labels and a title to our chart using
plt.xlabel(),plt.ylabel(), andplt.title(). - Finally, we display our chart with
plt.show().
This process demonstrates how we can seamlessly move from SQL data retrieval to data visualization using Python, all within the same script.
Lesson 3 – Advanced SQL and Python Integration
Let's explore a more complex example that showcases the power of combining SQL and Python:
import sqlite3
import pandas as pd
import matplotlib.pyplot as plt
# Connect to the database
conn = sqlite3.connect('world_population.db')
# Write a query to select the change in population by region and subregion from 2010-2020
query = """
SELECT region, subregion, sum(PopChange) as TotalPopChange
FROM population p
JOIN country_mapping c ON p.CountryCode = c.CountryCode
WHERE Year between 2010 and 2020
GROUP BY region, subregion
ORDER BY TotalPopChange DESC
LIMIT 10;
"""
# Read the query results into a pandas dataframe
df = pd.read_sql_query(query, conn)
# Close the database connection
conn.close()
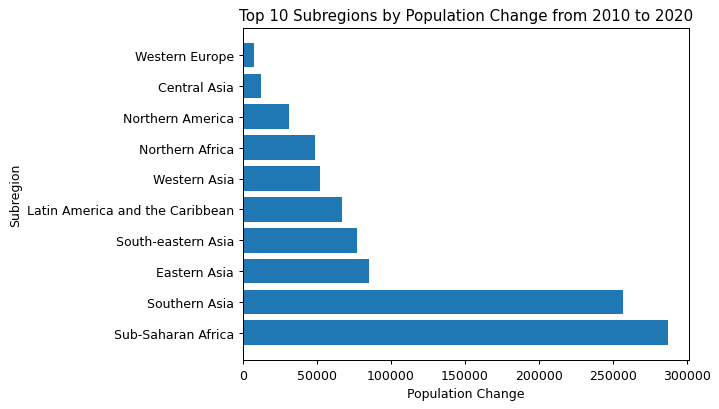
# Create a horizontal bar chart to visualize the results
plt.barh(df['SubRegion'], df['TotalPopChange'])
plt.title('Top 10 Subregions by Population Change from 2010 to 2020')
plt.xlabel('Population Change')
plt.ylabel('Subregion')
plt.show()In this example, we're using a more complex SQL query that joins two tables (population and country_mapping), calculates the total population change between 2010 and 2020 for each subregion, and returns the top 10 subregions with the most significant change.
We then use this data to create a horizontal bar chart, showcasing how we can use Python to visualize complex SQL query results. This demonstrates the power of combining SQL's data retrieval capabilities with Python's data visualization tools.
At Dataquest, we use this SQL-Python combination frequently. For instance, we analyze how students move through our courses. We might query our database to see which lessons have the highest completion rates, then visualize this data to spot trends. This helps us identify areas for improvement.
Based on my experience, here are a few tips when working with SQL and Python:
- Always close your database connections when you're done. This helps prevent potential issues.
- Be cautious with user inputs in your queries to prevent SQL injection.
- For large datasets, try processing data in smaller chunks. This can improve performance and reduce errors.
Combining SQL and Python takes practice, but it allows you to create insightful data visualizations. You'll be able to ask complex questions of your data and get answers in visually appealing formats.
Lesson 4 – Querying Databases with SQL and R
While this post focuses on Python, I want to acknowledge our R users who've stuck with us. If you're more comfortable with R, you'll be pleased to know that querying SQL from R works similarly to Python. Here's a quick example:
conn <- dbConnect(SQLite(), "jobs.db")
query <- "SELECT Major FROM recent_grads ORDER BY Major DESC"
result <- dbSendQuery(conn, query)
reverse_alphabetical <- dbFetch(result)

dbClearResult(result)
dbDisconnect(conn)
And here's what reverse_alphabetical looks like:
| Major |
|---|
| ZOOLOGY |
| VISUAL AND PERFORMING ARTS |
| UNITED STATES HISTORY |
| TREATMENT THERAPY PROFESSIONS |
This R code demonstrates the same fundamental process we've been discussing with Python:
- We connect to the SQLite database ("jobs.db"). (The full data has many more columns, but you can learn more about it at FiveThirtyEight's GitHub repository), if you're interested.)
- We define our SQL query, in this case selecting majors from the "recent_grads" table and ordering them in reverse alphabetical order.
- We send the query to the database and fetch the results.
- Finally, we clean up by clearing the result and disconnecting from the database.
As you can see, whether you're using Python or R, the core concepts of integrating SQL with a programming language remain the same. The syntax might differ slightly, but the workflow is remarkably similar. We've covered this and more in our Querying Databases with SQL and R course, if you want to learn more.
Advice from a SQL Expert
As I reflect on our exploration of SQL-Python integration, I'm amazed by how this powerful combination has transformed my approach to data analysis. At Dataquest, we've seen firsthand how these tools work together seamlessly, creating a versatile toolkit for tackling complex data challenges.
By combining SQL's robust querying capabilities with Python's flexible data manipulation, you can efficiently handle large datasets, automate repetitive tasks, and create sophisticated analyses. For example, you might use SQL to extract time-series data, then leverage Python's libraries for predictive modeling.
If you're new to this, don't let the idea of learning two languages overwhelm you. SQL's straightforward syntax pairs naturally with Python's intuitive approach. Start small - perhaps use SQLite to practice your Python-SQL integration skills in our Querying Databases with SQL and Python course. As you progress, you'll find yourself asking more complex questions of your data and uncovering deeper insights. We cover both languages in a carefully curated format in our Data Analyst in Python path if you're looking for a fully structured learning approach.
Remember, proficiency in both SQL and Python is highly valued in the data science job market. These skills prepare you for real-world challenges, from customer behavior analysis to sales forecasting. So keep practicing, stay curious, and explore your data with confidence. As you do, you'll uncover insights that might surprise you - and they could hold the key to solving important problems in your field.
Frequently Asked Questions
How can I start querying SQL databases using Python?
To get started with querying SQL databases using Python, you'll need to follow a few simple steps. By combining the power of SQL's data retrieval capabilities with Python's data manipulation and visualization tools, you'll be able to extract insights from your data more efficiently.
First, import the necessary libraries and establish a connection to your database. This will allow you to interact with your database and execute SQL queries.
import sqlite3
import pandas as pd

# Connect to the SQLite database
conn = sqlite3.connect('world_population.db')
Next, write and execute your SQL query. This is where you'll specify what data you want to retrieve from your database.
query = ('SELECT CountryName, Population FROM population WHERE Year=2020 LIMIT 10;')
results = pd.read_sql_query(query, conn)

# Print the results
print(results)
By using SQL to retrieve data and Python to manipulate and visualize it, you'll be able to perform complex analyses and create meaningful insights. For example, you can use SQL to extract time-series data from a database, and then use Python's powerful libraries for predictive modeling.
One of the benefits of this approach is the ability to create data visualizations directly from your query results. This can help you communicate your findings more effectively and gain a deeper understanding of your data.
import matplotlib.pyplot as plt

# Create a column chart of population data
plt.bar(data['Year'], data['Population'])
plt.xlabel('Year')
plt.ylabel('Population')
plt.title('Population of the United States of America by Year')
plt.show()
As you become more comfortable with querying SQL databases using Python, you'll be able to tackle more complex data science projects and extract even more insights from your data. Just remember to close your database connection when you're finished.
conn.close()Start with simple queries and gradually increase the complexity as you become more confident. With practice, you'll be able to ask complex questions of your data and get answers in visually appealing formats, enhancing your ability to derive meaningful insights from your databases.
What's the most effective approach to learning SQL querying in Python?
Learning SQL querying in Python is like acquiring a versatile tool for data analysis. The most effective approach combines structured learning with hands-on practice, allowing you to effectively use both SQL and Python.
Here's a step-by-step guide to getting started:
- Start with the basics: Learn to connect to databases using Python libraries like
sqlite3. This will give you a solid foundation for more advanced concepts. - Build a strong foundation in SQL queries: Practice writing and executing simple
SELECTstatements, and gradually incorporate more advanced concepts like subqueries in SQL. As you become more comfortable, you'll be able to tackle more complex queries. - Integrate Python data manipulation: Use libraries like
pandasto process and analyze data retrieved from your SQL queries. This will help you get the most out of your data. - Explore data visualization: Create insightful visualizations of your query results using Python libraries such as
matplotlib. This will help you communicate your findings effectively. - Apply your skills to real-world datasets: This practical experience will help you understand the value of combining SQL and Python. You'll be able to handle larger datasets efficiently, automate repetitive tasks, and perform sophisticated analyses.
The benefits of this approach are significant. For instance, you could use SQL to extract time-series data from a database, then use Python's libraries for predictive modeling.
However, be prepared for challenges. You might struggle with managing database connections or optimizing query performance for large datasets. To overcome these, always close your connections properly and consider processing data in smaller chunks.
Practical tips for improvement:
- Start with simple projects and gradually increase complexity as you become more confident.
- Use SQLite for practice without complex setups. This will allow you to focus on learning SQL without worrying about database management.
- Work on projects that combine SQL querying with Python analysis. This will help you see the value of integrating these skills.
- Join online communities to learn from others and share your experiences. This will help you stay motivated and learn from others in the field.
By consistently practicing and applying these skills, you'll be well-equipped to tackle complex data challenges and uncover valuable insights that could drive important decisions in your field.
What real-world benefits does integrating SQL and Python offer for data analysis?
When you combine SQL and Python for data analysis, you gain a powerful toolkit that can transform the way you work with data. By pairing SQL's strengths in data retrieval with Python's versatility in data manipulation and visualization, you can tackle complex challenges and uncover deeper insights.
One key advantage of this integration is the ability to handle large datasets more effectively. SQL excels at managing and querying extensive databases, while Python can quickly process and analyze the retrieved data. For example, you can use SQL to extract specific data from databases, including complex operations like subqueries, and then use Python's libraries such as pandas to further analyze the data.
As you work with data, you'll also appreciate how this integration enhances data visualization. After retrieving data with SQL queries, you can use Python's visualization libraries like matplotlib to create insightful charts. For instance:
import sqlite3
import pandas as pd
import matplotlib.pyplot as plt

conn = sqlite3.connect('world_population.db')
query = """
   SELECT Year, Population
     FROM population
    WHERE CountryName = 'United States of America';
    """
data = pd.read_sql_query(query, conn)

plt.bar(data['Year'], data['Population'])
plt.xlabel('Year')
plt.ylabel('Population')
plt.title('Population of the United States of America by Year')
plt.show()

conn.close()
This code demonstrates how you can seamlessly move from SQL data retrieval to creating a visualization in Python, all within the same script.
Another significant benefit of this integration is the automation of repetitive tasks. By using Python to generate and execute SQL queries, including those with subqueries, you can create more flexible and reusable code. This not only saves time but also reduces the risk of errors in your data analysis workflow.
In real-world applications, this integration proves invaluable. For example, a company might use SQL to extract customer purchase history from a large database, then use Python to analyze buying patterns and create predictive models for future sales. This combination enables more comprehensive and actionable business intelligence.
While integrating SQL and Python offers many benefits, it's essential to be aware of potential challenges, such as managing database connections and optimizing query performance for large datasets. However, with proper connection management practices and by processing data in smaller chunks when necessary, you can overcome these challenges.
In summary, combining SQL and Python provides a versatile toolkit for tackling complex data challenges. By leveraging SQL's data retrieval strengths and Python's analysis and visualization capabilities, you can gain deeper insights and make more informed decisions across various fields, from business intelligence to scientific research.
How can I use subqueries in SQL to enhance my Python-based data analysis?
Subqueries in SQL can be a powerful tool to improve your Python-based data analysis. By nesting one query within another, you can perform complex data retrieval and manipulation tasks more efficiently.
When you combine subqueries in SQL with Python, you can:
- Filter data based on aggregated or derived data
- Perform calculations on subsets of data
- Simplify complex queries by breaking them down into smaller, more manageable parts
For example, let's say you want to analyze population changes across regions. You can use a subquery to join two tables, calculate the total population change between 2010 and 2020 for each subregion, and return the top 10 subregions with the most significant change.
query = """
SELECT region, subregion, SUM(PopChange) AS TotalPopChange
  FROM population p
  JOIN country_mapping c ON p.CountryCode = c.CountryCode
 WHERE Year BETWEEN 2010 AND 2020
 GROUP BY region, subregion
 ORDER BY TotalPopChange DESC
 LIMIT 10;
"""
This query works by joining two tables, calculating the total population change, and returning the top 10 subregions with the most significant change.
To get the most out of subqueries in SQL with Python:
- Test your subqueries independently before incorporating them into larger queries
- Be mindful of performance, especially with large datasets
- Use clear aliases and comments to make your code easier to read
By using subqueries in SQL within your Python scripts, you can gain a deeper understanding of your data. This approach allows you to ask more complex questions and get more nuanced answers, ultimately leading to more informed decision-making in your data analysis projects.
What are some practical tips for creating data visualizations using SQL and Python together?
When it comes to creating effective data visualizations, combining SQL and Python can be a powerful approach. By leveraging SQL's strengths in data retrieval and Python's flexibility in visualization tools, you can uncover valuable insights in your data.
Here are some practical tips to get you started:
- Use SQL to efficiently retrieve and filter data, taking advantage of subqueries for complex selections or aggregations. Then, use Python's
pandaslibrary to easily manipulate this data withpd.read_sql_query(). - Python's
matplotliblibrary is a great tool for creating visualizations. For example: - When working with large datasets, consider processing data in smaller chunks to improve performance. This approach can help manage memory usage and reduce potential errors.
query = """
SELECT region, subregion, SUM(PopChange) AS TotalPopChange
  FROM population p
  JOIN country_mapping c ON p.CountryCode = c.CountryCode
 WHERE Year BETWEEN 2010 AND 2020
 GROUP BY region, subregion
 ORDER BY TotalPopChange DESC
 LIMIT 10;
"""
df = pd.read_sql_query(query, conn)
plt.barh(df['subregion'], df['TotalPopChange'])
plt.title('Top 10 Subregions by Population Change from 2010 to 2020')
plt.show()
This code demonstrates how to use a complex SQL query with joins and aggregations, transfer the results to a pandas DataFrame, and create a horizontal bar chart.
By combining SQL's data retrieval capabilities with Python's visualization tools, you can create insightful visualizations that help you understand your data better. This skill is particularly useful in fields like business intelligence or scientific research, where visualizing complex datasets is essential for decision-making. With practice, you can become proficient in creating impactful data visualizations that help you make sense of your data.
How does the SQL-Python combination compare to using SQL with other programming languages for data analysis?
When it comes to data analysis, combining SQL with Python offers a unique set of benefits. While SQL can be used with various programming languages, the Python integration stands out for its flexibility and ease of use.
Compared to using SQL with other languages like R, the SQL-Python combination offers similar core functionality but with some key advantages. Both approaches allow for querying databases and performing data analysis, but Python's extensive ecosystem of libraries for data manipulation and visualization makes it a more versatile choice.
One of the key strengths of the SQL-Python combination is its ability to leverage SQL's robust data retrieval capabilities, including advanced features like subqueries in SQL. This allows for efficient handling of large datasets and creation of sophisticated analyses. For example, you can use complex SQL queries with subqueries to extract specific data from a database, then use Python's pandas and matplotlib libraries to process this data and create visualizations, all within the same script.
The SQL-Python integration excels in scenarios requiring advanced data manipulation and visualization. While R also offers strong statistical capabilities, Python's broader application in areas like machine learning and web development makes it a more versatile choice for many data professionals.
However, it's worth noting that using SQL with Python can present some challenges, such as managing database connections and optimizing query performance for large datasets. By following best practices like closing connections promptly and processing data in smaller chunks when necessary, you can overcome these challenges.
In summary, the SQL-Python combination provides a comprehensive toolkit for data analysis, offering efficient data retrieval, powerful manipulation capabilities, and advanced visualization options. This integration is particularly valuable for tackling complex data challenges and creating insightful visualizations, making it a popular choice among data analysts and scientists.
How can I efficiently improve my SQL querying skills in R?
To improve your SQL querying skills in R, follow these steps:
- Start with the basics: Begin with simple SQL concepts and syntax. Practice writing basic
SELECTstatements, then gradually add more complex clauses likeWHERE,GROUP BY, andHAVING. This foundation is important for understanding more advanced techniques later. - Use R-specific SQL packages: Familiarize yourself with packages like
RSQLiteorRMySQL. These tools allow you to interact with databases directly from R, providing seamless integration between SQL queries and R's data manipulation capabilities. - Practice with real-world data: Work with actual databases to gain practical experience. You can use public datasets or create your own SQLite database. This hands-on approach helps you understand how SQL queries behave with different data structures and volumes.
- Explore advanced techniques: As you progress, explore more sophisticated SQL concepts, including subqueries. For example, you might use a subquery to filter results based on aggregate calculations:
- Combine SQL with R's data manipulation tools: Use SQL to efficiently retrieve data from databases, then use R's powerful libraries like
dplyrordata.tablefor further analysis. This combination allows you to take advantage of the strengths of both SQL and R. - Focus on query optimization: Learn to write efficient queries by understanding execution plans and using appropriate indexing. This skill is important when working with large datasets, where query performance can significantly impact analysis time.
- Automate and streamline your workflow: Use R to generate SQL queries dynamically. This approach allows you to create more flexible and reusable code, saving time on repetitive tasks and reducing the risk of errors.
SELECT column_name
  FROM table_name
 WHERE column_name > (
       SELECT AVG(column_name)
         FROM table_name
       );
This query selects values above the average, demonstrating how subqueries can enhance your data retrieval capabilities.
While improving your skills, be prepared to tackle challenges such as managing large datasets or complex join operations. To overcome these, break down complex queries into smaller parts and test each component separately. Additionally, consider using temporary tables or common table expressions (CTEs) to simplify complex subqueries in SQL.
By consistently applying these strategies, you'll develop skills in extracting, manipulating, and analyzing data efficiently using SQL and R. This powerful combination of skills is highly valued in data science and can open up opportunities for sophisticated data analysis, from customer behavior prediction to financial forecasting.
What are the basic steps to query SQL databases with R?
If you're looking to work with data more efficiently, you'll want to learn how to query SQL databases with R. This integration allows you to tap into the strengths of both SQL and R, making it easier to handle large datasets and complex analyses. Here's a step-by-step guide to get you started:
- Install and load the necessary R package for database connectivity (e.g.,
RSQLitefor SQLite databases). - Establish a connection to your database using the appropriate function (e.g.,
dbConnect()). - Write your SQL query as a string in R.
- Execute the query and fetch the results using functions like
dbSendQuery()anddbFetch(). - Process and analyze the retrieved data using R's data manipulation functions.
- Close the database connection when you're finished.
Here's an example that demonstrates these steps:
conn <- dbConnect(SQLite(), "jobs.db")
query <- "SELECT Major FROM recent_grads ORDER BY Major DESC"
result <- dbSendQuery(conn, query)
reverse_alphabetical <- dbFetch(result)

dbClearResult(result)
dbDisconnect(conn)
This code connects to a SQLite database named "jobs.db", sends a query to select majors in reverse alphabetical order, fetches the results into an R object, and then properly closes the connection.
You might be surprised to learn that querying SQL databases is quite similar whether you're using R or Python. The main difference lies in the syntax, but the overall process is the same. By combining SQL queries with R's statistical functions and plotting libraries, you can gain valuable insights into your data.
For instance, you could use this method to analyze trends in college majors and employment outcomes. By bringing together SQL and R, you can uncover insights such as which majors have the highest employment rates or salaries over time.
By following these steps and practicing with your own data, you'll become more comfortable working with SQL databases in R. This will open up a world of possibilities for data analysis, from exploratory data analysis to complex statistical modeling.