40+ Data Analyst Interview Questions and Answers for 2026 [Entry-Level Guide With Code]
You've studied SQL, practiced Python, reviewed statistics concepts. But when you think about the actual Data Analyst interview, the questions start: "Am I ready for the interview? What if I freeze? What if they ask something I don't know? How do I know if I know enough?”
This guide cuts through that uncertainty. It's 40+ real interview questions across SQL, Python, statistics, business acumen, and behavioral topics—the exact areas hiring managers test. Each question includes why interviewers ask it, what makes a good answer, working code examples, and honest context about what employers actually expect.
After working through this guide, you'll know what to expect, understand the patterns interviewers look for, and feel genuinely confident in interviews. You'll realize you already know way more than you think. What you don't know, you'll know how to approach.
Getting to the interview stage is the hardest part and Dataquest can help you confidently prepare for that. Our Data Analyst career path takes you from "I don't know where to start" to "I'm ready to interview" in 3-6 months with hands-on projects and real-world preparation. This guide accelerates that journey by showing you exactly what interviews test, so you can focus your preparation where it matters most.
What's Inside
- What Interviews Actually Look Like
- SQL Interview Questions: The Foundation (15 Questions)
- Statistics & Probability (6 Questions)
- Python for Data Analysis (6 Questions)
- Data Visualization & Storytelling (4 Questions)
- Business Acumen & Case Studies (6 Questions)
- Behavioral Questions (6 Questions)
- Questions to Ask Your Interviewer
- Getting Started: Your Interview Prep Strategy
- Key Takeaways
What Interviews Actually Look Like
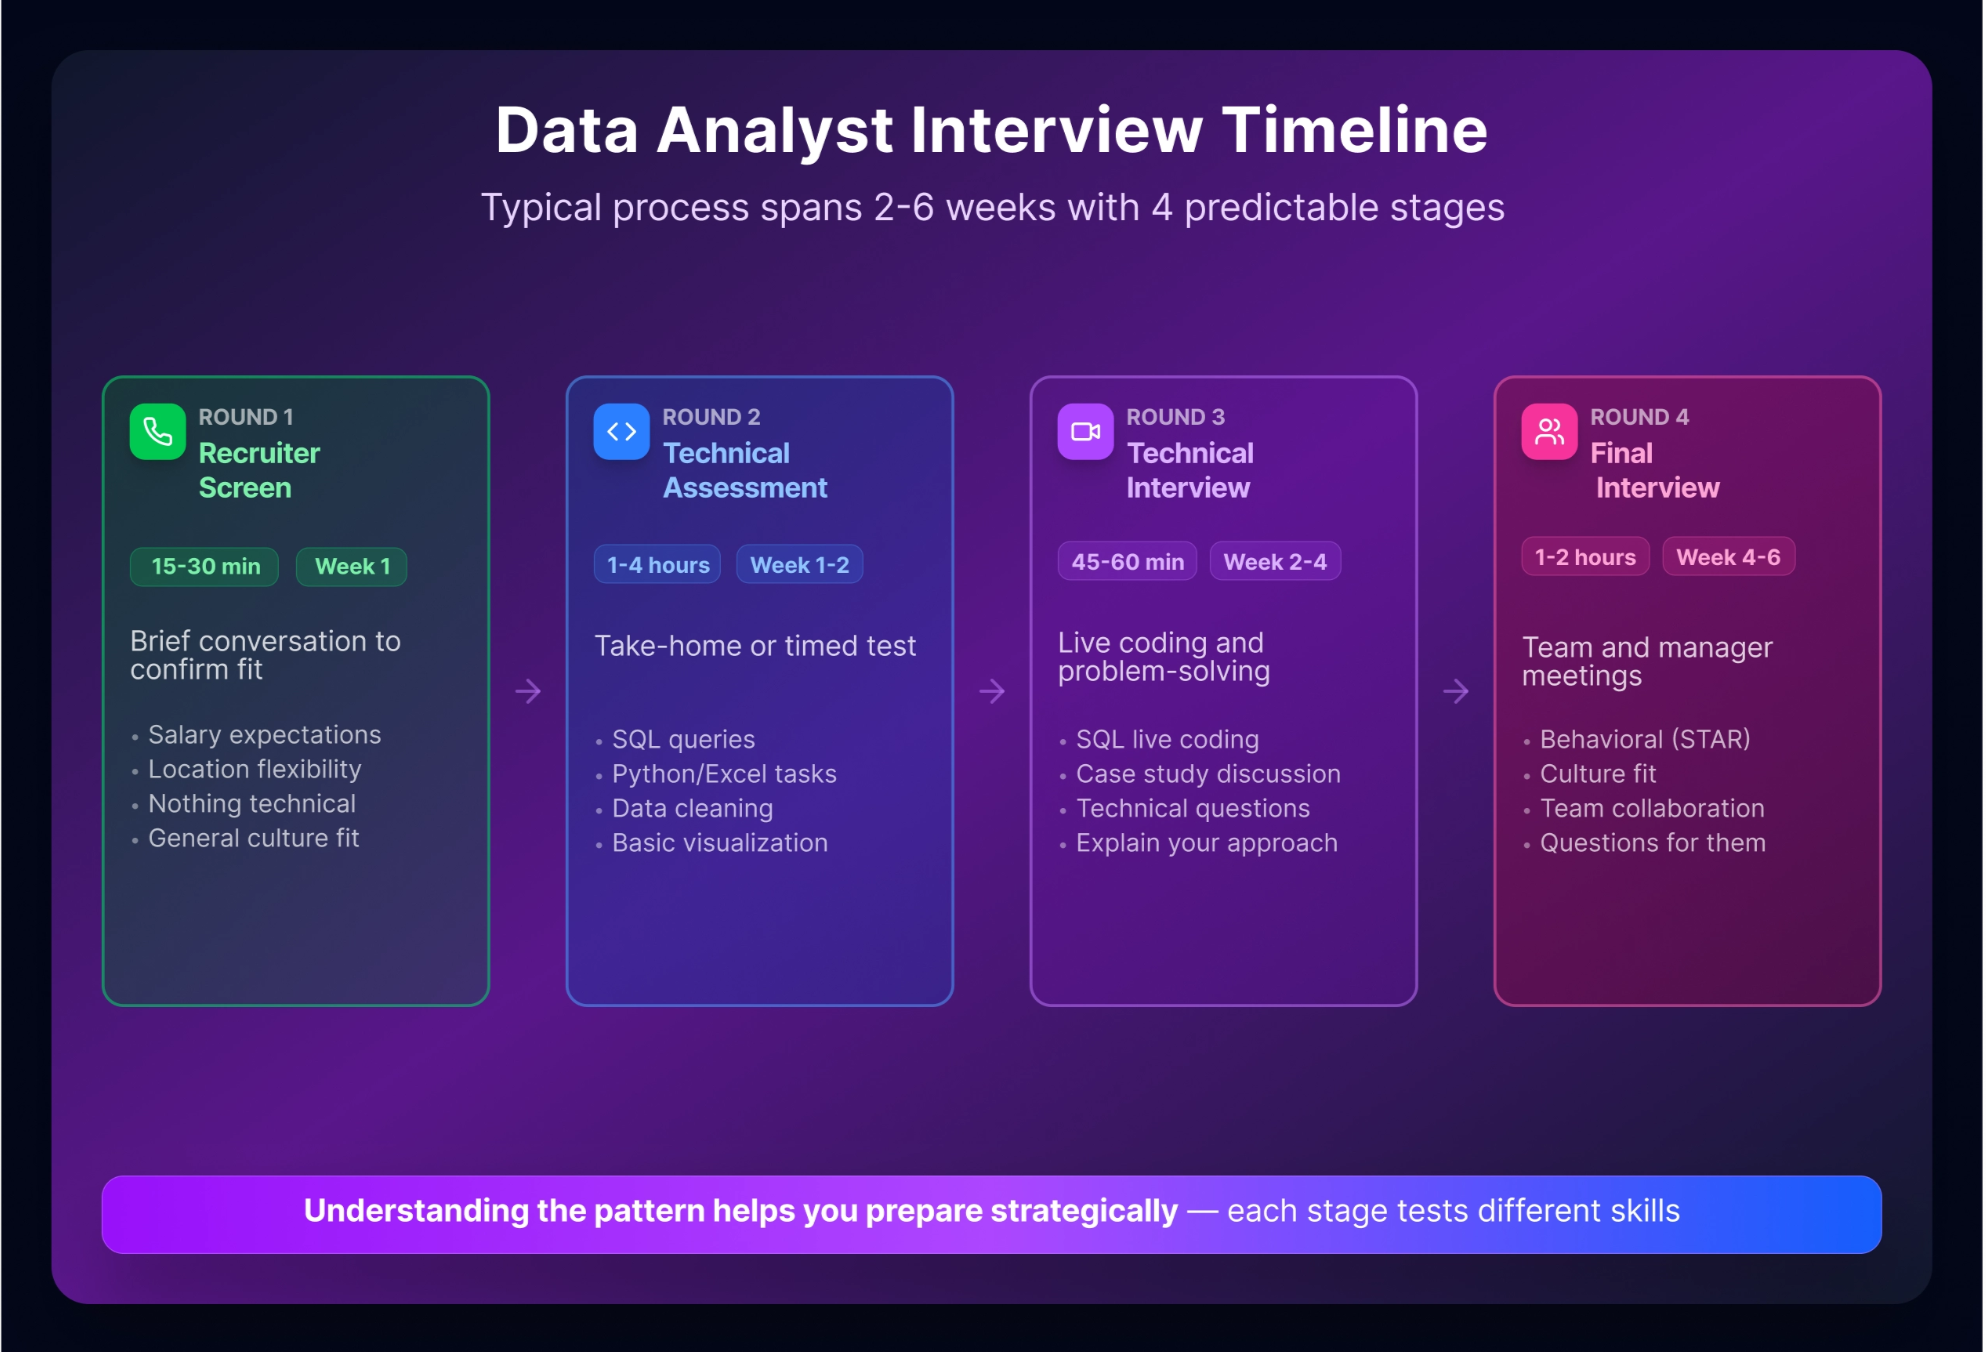
A data analyst interview often takes multiple rounds over a few weeks and usually follows a predictable pattern. The first round is your recruiter screen: a brief 15-30 minute conversation where they confirm salary expectations, location flexibility, and general culture fit. Nothing technical here, just a conversation.
Round two is the hiring manager interview (30-60 minutes). They’ll ask behavioral questions like “Tell me about yourself,” explore your background, and explain what the role actually involves. This is where you show interest in their specific problems, not just generic interest in data.
The technical screen (45-90 minutes) is where most candidates feel the pressure. You’ll typically solve SQL problems using a shared coding environment or live SQL editor, possibly answer Python questions, and discuss statistics concepts. Most candidates are underprepared in SQL. Not fancy dashboards or ML algorithms, but plain solid SQL.
Many companies also assign take-home projects (appearing in approximately 25-40% of roles). You’ll receive a messy dataset, answer business questions using SQL or Python, create visualizations, and present findings. These are often scoped as a few hours of active work, but candidates commonly spend one to two evenings polishing the analysis and write-up, and interviewers usually evaluate your reasoning, structure, and communication more than your speed.
The final round might be a panel interview, presentation of your take-home assignment, or additional technical questions. By this stage, they’re usually assessing culture fit and confirming technical competence.
What interviewers evaluate beyond correctness: Can you think through ambiguous business problems without panicking? Can you explain your reasoning clearly? Do you ask clarifying questions when something’s unclear? How do you respond when you don’t know an answer? (Hint: “I don’t know, let me research” is often better than guessing.)
SQL Interview Questions: The Foundation (15 Questions)
SQL appears in roughly 85% of data analyst interviews. This isn’t optional—it’s the core skill that separates candidates who move forward from those who don’t.
The critical insight from practitioners: Most candidates study SQL syntax without learning how to apply it to actual business questions—the work you’ll actually do on the job. The gap is real, and practicing with abstract queries like “explain a JOIN” doesn’t close it. What works is practicing with real datasets and framing every question as a business problem: not “write a query to use JOINs,” but “Marketing needs customers who registered but never purchased—what’s your approach?”
This changes everything about how you prepare. You’re not trying to memorize functions. You’re training your brain to see a business problem, decompose it logically, and translate it into SQL. Practice with real datasets and frame every question as a business problem: not “write a query to use JOINs,” but “Marketing needs customers who registered but never purchased—what’s your approach?”
Entry-Level SQL (5 Questions)
Question 1: JOINs in a Business Context
Your company has a customers table and an orders table. Marketing wants to identify customers who registered but never placed an order. How would you find them, and why would you use that JOIN type?
Your company has a customers table and an orders table. Marketing wants to identify customers who registered but never placed an order. How would you find them, and why would you use that JOIN type?
Why interviewers ask this: JOINs are foundational. They want to see if you understand the difference between INNER JOIN, LEFT JOIN, and how each filters data. They’re also checking if you can translate a business need into a query strategy.
What makes a good answer: You should explain LEFT JOIN specifically: keeping all customers and filtering where orders is NULL. You should explain why this works (NULL values indicate customers with no matching orders), not just write the code.
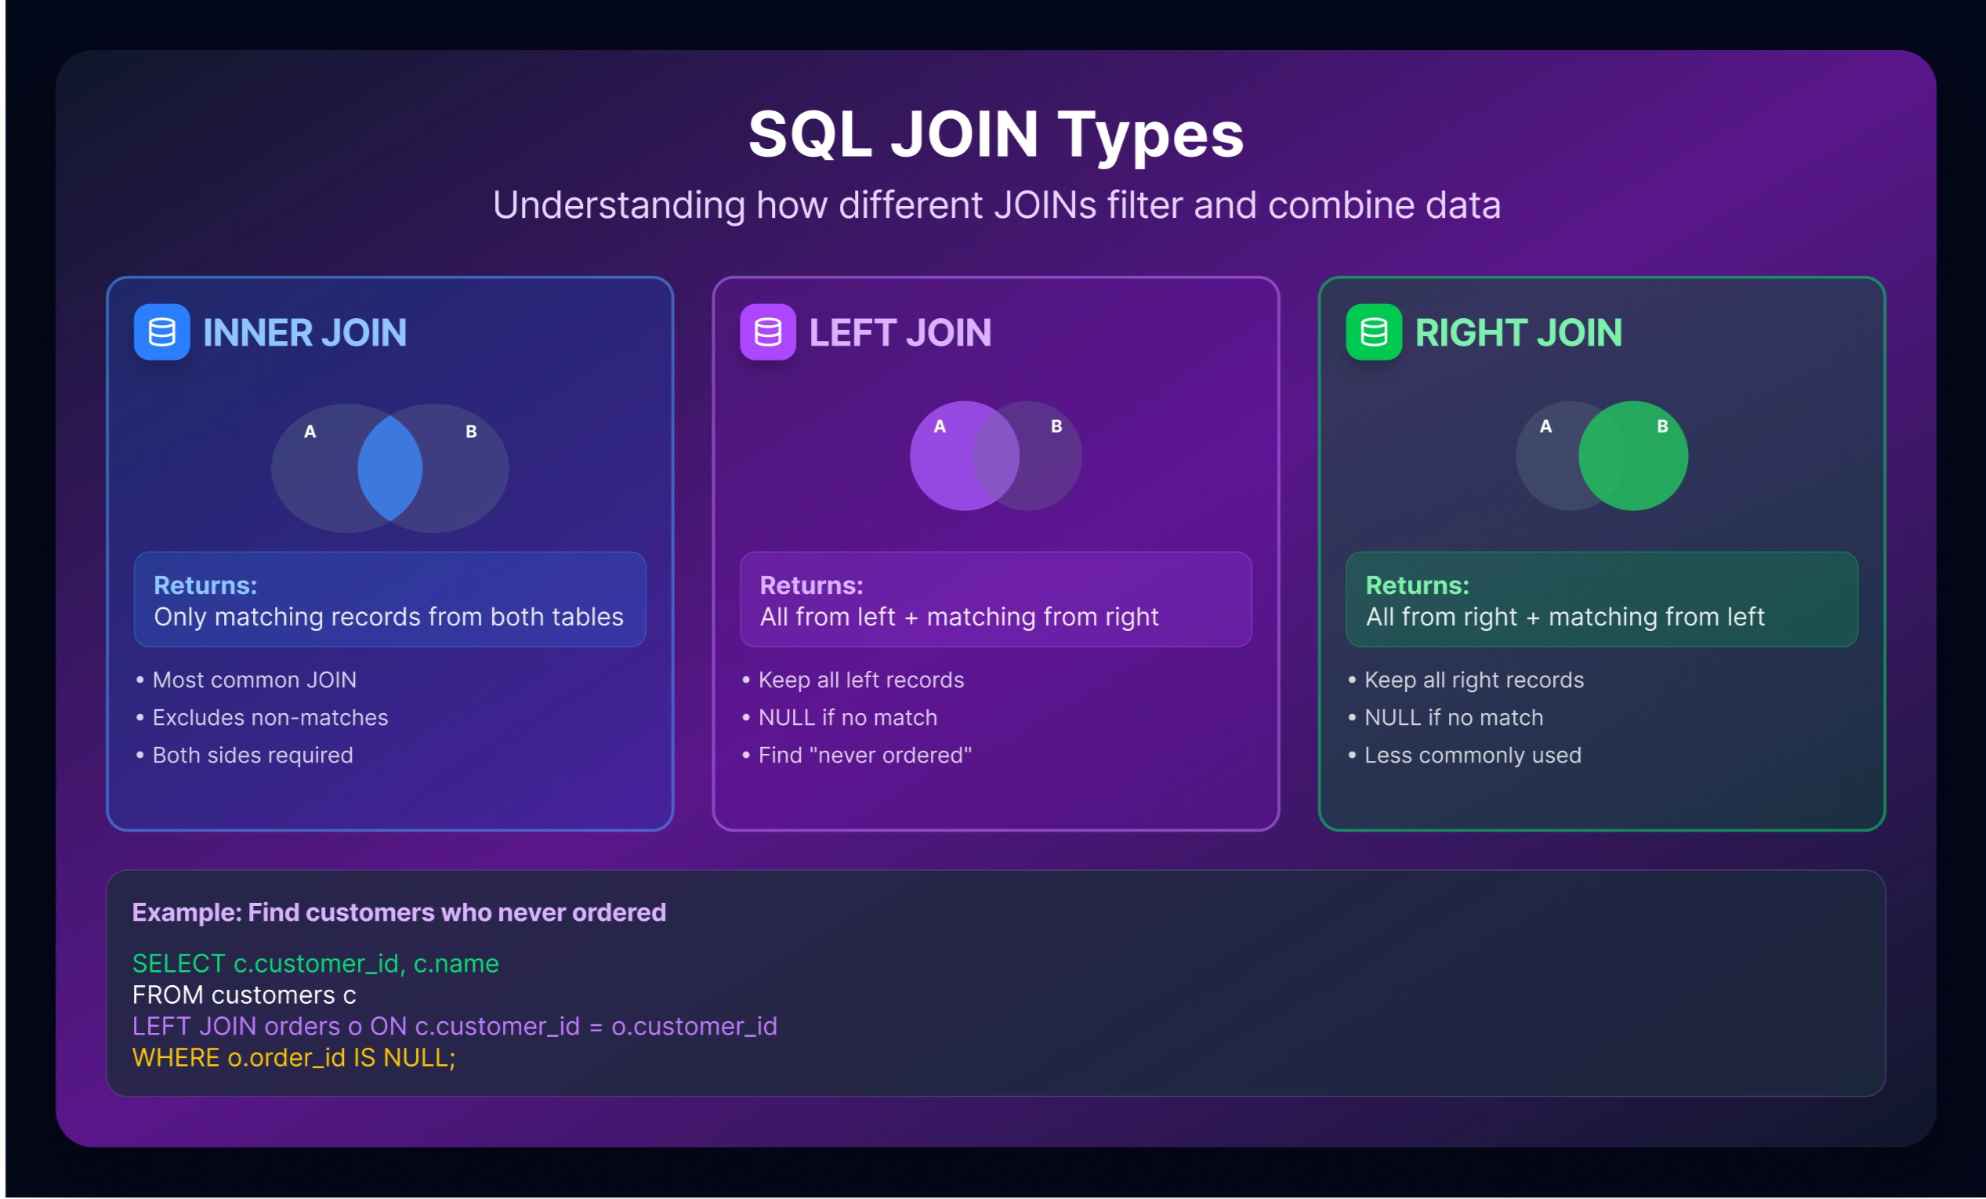
Alternative approach: You could use a NOT IN or NOT EXISTS subquery, though LEFT JOIN with WHERE IS NULL is cleaner and typically preferred.
💡 For career changers: If you don’t have professional SQL experience, reference a portfolio project. For example: “In my bootcamp capstone, I worked with ecommerce data and used LEFT JOIN to identify inactive users (customers with accounts but no purchases in the last six months).”
Question 2: GROUP BY and Aggregation
Sales leadership wants total revenue by product category and month. Walk me through your approach.
Sales leadership wants total revenue by product category and month. Walk me through your approach.
Why interviewers ask this: GROUP BY is practical. You’ll use it constantly. They’re checking if you understand aggregation logic, handling of date fields, and ordering results for readability. This also tests whether you can break down a business requirement into logical steps.
What makes a good answer: Explain your grouping strategy first (why category AND month?), then show the query. Walk through what each line does. Mention ordering results in a useful way (chronologically, highest revenue first).
SELECT
  product_category,
  DATE_TRUNC('month', order_date) AS month,
  SUM(revenue) AS total_revenue
FROM orders
GROUP BY product_category, DATE_TRUNC('month', order_date)
ORDER BY month DESC, total_revenue DESC;
Alternative approach: If your database doesn’t support DATE_TRUNC, you could use EXTRACT(YEAR_MONTH FROM order_date) or equivalent syntax for your specific database.
💡 For career changers: “In my portfolio project analyzing [dataset], I calculated monthly metrics by segment using GROUP BY. I learned that ordering results chronologically makes it much easier to spot trends.”
Question 3: WHERE vs. HAVING
What’s the difference between WHERE and HAVING clauses? When would you use each?
Why interviewers ask this: Many candidates confuse these. This tests whether you understand query execution order and filtering logic at different stages. Interviewers want to see you think about efficiency—WHERE filters before aggregation (faster), HAVING filters after (necessary for aggregate conditions).
What makes a good answer: Explain that WHERE filters individual rows before aggregation, while HAVING filters aggregated groups after GROUP BY. Show both in a single query to demonstrate you understand the difference.
SELECT
  product_category,
  COUNT(*) AS order_count,
  AVG(order_value) AS avg_value
FROM orders
WHERE order_date >= '2025-01-01'  -- Filter individual rows before aggregation
GROUP BY product_category
HAVING COUNT(*) > 10  -- Filter groups after aggregation
ORDER BY avg_value DESC;
This query filters to recent orders first (WHERE), groups by category, then shows only categories with 10+ orders (HAVING).
💡 For career changers: “I use WHERE constantly because it’s more efficient—filtering before aggregation. HAVING is rarer but essential when you need to filter based on aggregated results like ‘show me categories where average order value exceeds \$500.’”
Question 4: UNION vs. UNION ALL
You need to combine Q1 and Q2 sales data into a single result set. When would you use UNION versus UNION ALL?
Why interviewers ask this: Simple question, but mistakes here are costly. UNION removes duplicates (slower), UNION ALL keeps them (faster). Shows if you think about performance and understand data structure implications.
What makes a good answer: UNION removes duplicate rows, UNION ALL keeps all rows. You’d use UNION ALL for appending Q1 and Q2 data because they’re separate time periods—no duplicates expected. UNION makes sense when combining overlapping datasets where you need unique results.
-- UNION ALL (typically correct for time-period data)
SELECT sales_id, amount, 'Q1' AS quarter FROM q1_sales
UNION ALL
SELECT sales_id, amount, 'Q2' AS quarter FROM q2_sales;

-- Would use UNION if combining overlapping datasets needing deduplication
SELECT customer_id FROM newsletter_subscribers_list_1
UNION
SELECT customer_id FROM newsletter_subscribers_list_2;
💡 For career changers: “Performance matters. When you have large datasets, UNION ALL is faster because it doesn’t remove duplicates. Always ask yourself: ‘Could there actually be duplicates here?’ If no, use UNION ALL.”
Question 5: Finding Missing Data
How would you find all customers in the customers table who don’t appear in the orders table?
Why interviewers ask this: Practical question that tests your comfort with JOINs and NULL logic. This comes up constantly in data quality checks and business analysis. Interviewers want to see you can identify data gaps, not just retrieve data.
What makes a good answer: Use LEFT JOIN with WHERE IS NULL. Show you understand this is identifying data gaps (which might be expected—inactive customers), not errors. Explain your reasoning: why LEFT JOIN keeps all customers, why IS NULL identifies those without orders.
SELECT c.customer_id, c.customer_name
FROM customers c
LEFT JOIN orders o ON c.customer_id = o.customer_id
WHERE o.order_id IS NULL;
Alternative approach: You could use NOT IN or NOT EXISTS subqueries, but LEFT JOIN is clearer and performs better on large datasets.
💡 For career changers: “This pattern is everywhere in real analysis. Identifying inactive customers, unmatched records, or gaps in data. Once you master this LEFT JOIN pattern, you’ll use it constantly.”
Intermediate SQL (6 Questions)
Question 6: CTEs (Common Table Expressions)
What’s a CTE and when would you use one instead of a subquery? Give an example.
Why interviewers ask this: CTEs make complex queries readable and maintainable. Interviewers want to see you write code that other people can understand, not just code that works. This signals you think about team collaboration and future maintenance.
What makes a good answer: CTEs are temporary named result sets that make complex logic readable. They’re useful for multi-step logic, recursive queries, and making subqueries reusable. Explain that CTEs improve readability compared to nested subqueries.
WITH customer_orders AS (
  SELECT customer_id, COUNT(*) AS order_count, SUM(amount) AS lifetime_value
  FROM orders
  GROUP BY customer_id
)
SELECT c.customer_name, co.order_count, co.lifetime_value
FROM customers c
JOIN customer_orders co ON c.customer_id = co.customer_id
WHERE co.order_count > 5
ORDER BY co.lifetime_value DESC;
This is clearer than nesting a subquery inside the FROM clause. The CTE has a descriptive name, making the logic obvious.
💡 For career changers: “I initially found subqueries intimidating, but CTEs changed how I think about complex logic. They’re like breaking down a problem into labeled steps, which is exactly how you should think when solving problems.”
Question 7: RANK vs. DENSE_RANK vs. ROW_NUMBER
What’s the difference between these three window functions? Write a query to rank employees by salary within each department.
Why interviewers ask this: Frequently tested because window functions are powerful and often misunderstood. Interviewers want to see if you can handle complex analytical tasks. This is differentiating knowledge—many entry-level candidates haven’t used window functions yet.
What makes a good answer: Explain each clearly with the execution difference. ROW_NUMBER gives unique sequential numbers (1, 2, 3). RANK creates gaps when there are ties (1, 1, 3). DENSE_RANK doesn’t create gaps (1, 1, 2). Show why this matters with a concrete example.
SELECT
  department,
  employee_name,
  salary,
  ROW_NUMBER() OVER (PARTITION BY department ORDER BY salary DESC) AS row_num,
  RANK() OVER (PARTITION BY department ORDER BY salary DESC) AS rank,
  DENSE_RANK() OVER (PARTITION BY department ORDER BY salary DESC) AS dense_rank
FROM employees
ORDER BY department, salary DESC; ![]()
💡 For career changers: “Window functions were a lightbulb moment for me. Once you understand PARTITION BY and ORDER BY, you can solve problems that would otherwise require complex GROUP BY logic.”
Question 8: Month-Over-Month Growth with LAG
Calculate month-over-month revenue growth. Show the current month revenue, previous month revenue, and growth percentage.
Why interviewers ask this: Tests practical use of window functions for business metrics. This is real analytical work—companies constantly track growth trends. Interviewers want to see you can combine aggregation with window functions.
What makes a good answer: Use LAG to reference the previous month’s value, then calculate the percentage change. Explain the logic: you need monthly totals first, then compare each month to the one before.
WITH monthly_revenue AS (
  SELECT
    DATE_TRUNC('month', order_date) AS month,
    SUM(revenue) AS total_revenue
  FROM orders
  GROUP BY 1
),
with_prev AS (
  SELECT
    month,
    total_revenue,
    LAG(total_revenue) OVER (ORDER BY month) AS prev_month_revenue
  FROM monthly_revenue
)
SELECT
  month,
  total_revenue,
  prev_month_revenue,
  ROUND(
    ((total_revenue - prev_month_revenue) / NULLIF(prev_month_revenue, 0)) * 100,
    2
  ) AS growth_percent
FROM with_prev
ORDER BY month;
💡 For career changers: “LAG and LEAD are magical for time-series analysis. This pattern—comparing values across time periods—comes up constantly in real work.”
Question 9: Identifying Duplicate Records
You suspect your customer table has duplicates. Write a query to find all customers with duplicate email addresses and show how many times each appears.
Why interviewers ask this: Data quality is essential. Interviewers want to see you proactively think about data integrity, not just query what’s there. This tests your ability to use GROUP BY and HAVING together.
What makes a good answer: Use GROUP BY to aggregate by email, HAVING to filter groups appearing more than once, ORDER BY to show worst offenders first.
SELECT
  email,
  COUNT(*) AS duplicate_count,
  STRING_AGG(customer_id::text, ', ') AS customer_ids
FROM customers
GROUP BY email
HAVING COUNT(*) > 1
ORDER BY duplicate_count DESC;
Database compatibility note: The STRING_AGG() function shown is PostgreSQL-specific. Other databases use different syntax for combining values into a comma-separated list:
- MySQL:
GROUP_CONCAT(customer_id) - SQL Server:
STRING_AGG(CAST(customer_id AS VARCHAR(MAX)), ', ') - SQLite:
GROUP_CONCAT(customer_id)
If you're using a different database, swap that function accordingly or simply remove the IDs list and keep the COUNT(*) result.
Alternative approach: You could use ROW_NUMBER and a CTE to flag all duplicates, but GROUP BY with HAVING is simpler for identifying which records are duplicated.
💡 For career changers: “Duplicate detection is one of the first things analysts do with new data. Learning to spot these issues shows you think like a data professional, not just someone writing queries.”
Question 10: CASE Statements for Segmentation
Create a customer segment field based on lifetime spending: ‘High Value’ if >\$1000, ‘Medium’ if >\$500, otherwise ‘Low’. Write the query.
Why interviewers ask this: CASE statements are used constantly for business logic and categorization. Interviewers want to see you can translate business rules into code. This also tests if you can work with multiple conditions logically.
What makes a good answer: Show clear CASE syntax with conditions in the right order. Explain why order matters (first true condition wins). Show the join to aggregate lifetime spending.
SELECT
  c.customer_id,
  c.customer_name,
  COALESCE(SUM(o.amount), 0) AS lifetime_spend,
  CASE
    WHEN COALESCE(SUM(o.amount), 0) > 1000 THEN 'High Value'
    WHEN COALESCE(SUM(o.amount), 0) > 500 THEN 'Medium'
    ELSE 'Low'
  END AS segment
FROM customers c
LEFT JOIN orders o ON c.customer_id = o.customer_id
GROUP BY c.customer_id, c.customer_name
ORDER BY lifetime_spend DESC;
💡 For career changers: “CASE statements feel clunky at first, but they’re how you encode business logic in SQL. Once comfortable, you’ll use them for scoring, segmentation, and categorization constantly.”
Question 11: Date Manipulation
Write a query to extract sales from the previous 6 months. Handle cases where DATEADD or date subtraction syntax might vary by database.
Why interviewers ask this: Date logic is surprisingly tricky and frequently asked. Interviewers want to see you understand your database’s date functions and can handle time-based filtering. This also tests if you know that syntax varies between databases.
What makes a good answer: Show the logic first (today minus 6 months), then the code. Acknowledge syntax differences if relevant.
-- PostgreSQL
SELECT customer_id, order_date, amount
FROM orders
WHERE order_date >= CURRENT_DATE - INTERVAL '6 months'
ORDER BY order_date DESC;

-- SQL Server
SELECT customer_id, order_date, amount
FROM orders
WHERE order_date >= DATEADD(month, -6, CAST(GETDATE() AS DATE))
ORDER BY order_date DESC;

-- MySQL
SELECT customer_id, order_date, amount
FROM orders
WHERE order_date >= DATE_SUB(CURDATE(), INTERVAL 6 MONTH)
ORDER BY order_date DESC;
💡 For career changers: “Date syntax trips up everyone. Even experienced analysts need to check documentation. The key is understanding the concept—getting the last 6 months—and knowing that syntax varies by database.”
Advanced SQL (4 Questions)
Question 12: Query Optimization
A query on a table with 50 million rows is running slowly. Walk me through how you’d diagnose and improve performance.
Why interviewers ask this: Real-world experience matters. Interviewers want to see you think beyond “does it work?” to “does it work efficiently?” This tests problem-solving approach and awareness of optimization basics.
What makes a good answer: Follow a diagnostic approach: check indexes on join/filter columns, review the execution plan, look for full table scans or unnecessary operations, consider breaking complex queries into CTEs. Reference tools like EXPLAIN PLAN documentation.
Common optimization techniques:
- Add indexes on WHERE and JOIN columns
- Avoid SELECT * on large tables (specify needed columns)
- Filter early (WHERE before JOIN when possible)
- Use EXPLAIN/EXPLAIN PLAN to see actual execution
- Break complex logic into CTEs (sometimes helps optimizer)
- Consider materialized views for repeated aggregations
💡 For career changers: “You won’t be expected to optimize like a database administrator, but showing you think about efficiency demonstrates maturity. Name the tools you’d use (EXPLAIN PLAN) and the approach (check indexes, filter early), and you’ll impress interviewers.”
Question 13: Subqueries vs. CTEs vs. Derived Tables
Compare these three approaches. When would you use each? What are the tradeoffs?
Why interviewers ask this: Tests conceptual understanding of SQL approaches. Interviewers want to see you can choose the right tool for the situation, not just use whatever works.
What makes a good answer:
- Subqueries: Inline queries in WHERE, FROM, or SELECT clauses. Good for simple, one-time logic. Harder to read when nested deeply.
- CTEs: Named temporary result sets. Best for readability and reusable logic within a query. Can reference themselves (recursion).
- Derived Tables: Subqueries in FROM clause (older SQL versions). Similar to CTEs but less readable.
-- Subquery approach
SELECT c.customer_name, o.order_count
FROM customers c
JOIN (
  SELECT customer_id, COUNT(*) AS order_count
  FROM orders
  GROUP BY customer_id
) o ON c.customer_id = o.customer_id
WHERE o.order_count > 5;

-- CTE approach (preferred for readability)
WITH customer_orders AS (
  SELECT customer_id, COUNT(*) AS order_count
  FROM orders
  GROUP BY customer_id
)
SELECT c.customer_name, co.order_count
FROM customers c
JOIN customer_orders co ON c.customer_id = co.customer_id
WHERE co.order_count > 5;
Performance is often similar (depends on database optimizer), but CTEs win on readability.
Question 14: INSERT INTO and Data Loading
You’ve processed new customer data in a staging table. Write a query to insert these new records into the production customers table, avoiding duplicates.
Why interviewers ask this: Real-world data workflows involve loading, appending, and updating data. Interviewers want to see you understand data integrity when adding records—not just SELECT queries.
What makes a good answer: Show INSERT INTO with a SELECT that checks for duplicates (using NOT IN, NOT EXISTS, or LEFT JOIN). Explain why deduplication matters.
INSERT INTO customers (customer_id, customer_name, email, created_date)
SELECT customer_id, customer_name, email, CURRENT_DATE
FROM staging_customers_new
WHERE email NOT IN (SELECT email FROM customers WHERE email IS NOT NULL)
  AND customer_id NOT IN (SELECT customer_id FROM customers);
Alternative approach: Use LEFT JOIN to check for existing records and filter out matches.
💡 For career changers: “Data loading is less glamorous than analysis, but it’s critical. Showing you know to check for duplicates before inserting demonstrates you think about data quality.”
Question 15: Data Quality Investigation
You discover a table has inconsistent date formats (some MM/DD/YYYY, some DD/MM/YYYY). How would you approach cleaning this? Write the investigation query first.
Why interviewers ask this: Tests real-world problem-solving. Interviewers want to see you identify the problem before jumping to fixes. This also tests domain knowledge (you need to understand which format is correct).
What makes a good answer: Start with diagnosis—identify which records are malformed. Then develop a strategy for fixing.
-- Investigation: identify suspicious dates
SELECT
  date_column,
  CAST(date_column AS DATE) AS parsed_date,
  CASE
    WHEN CAST(date_column AS DATE) > CURRENT_DATE THEN 'Future date (likely DD/MM)'
    ELSE 'Likely correct'
  END AS date_quality
FROM orders
WHERE date_column IS NOT NULL
ORDER BY parsed_date DESC
LIMIT 100;

-- Once identified, use conditional logic to parse correctly
SELECT
  CASE
    WHEN CAST(date_column AS DATE) > CURRENT_DATE
      THEN TO_DATE(date_column, 'DD/MM/YYYY')
    ELSE TO_DATE(date_column, 'MM/DD/YYYY')
  END AS cleaned_date
FROM orders;
💡 For career changers: “Real data is messy. Showing you can diagnose the problem systematically—not just guess at a fix—demonstrates analytical thinking. Always understand the problem before attempting the solution.”
Statistics & Probability (6 Questions)
Statistics questions test whether you understand the concepts that drive business decisions. You won’t need to calculate by hand, but you need to understand why these techniques matter and when to use them. Interviewers are checking if you can explain statistical concepts to non-technical stakeholders and make data-driven recommendations.
Question 16: Descriptive vs. Inferential Statistics
Your company analyzed 100 customers and found average order value is \$150. Can you conclude that the overall customer base has \$150 average order value? Why or why not?
Why interviewers ask this: Tests conceptual understanding beyond formulas. This is fundamental to good analysis—knowing the difference between what you observed and what you can claim about the broader population.
What makes a good answer: No. 100 customers is a sample. Descriptive statistics describe what you observed in your sample. Inferential statistics use that sample to estimate or test claims about the entire population. You’d need confidence intervals and significance tests to draw conclusions about all customers.
Key concepts to explain:
- Sample vs. population distinction
- Why random sampling matters (reduces bias)
- Confidence intervals (e.g., “We’re 95% confident the true average is between \$140-\$160”)
- Margin of error
💡 For career changers: “This difference is crucial for analysis. Your job is often explaining to non-technical stakeholders why you can’t claim something based on incomplete data. Understanding this deeply makes you invaluable.”
Question 17: P-Values for Non-Technical Stakeholders
Your team ran an A/B test and got a p-value of 0.03. How would you explain what this means to a marketing manager who doesn’t know statistics?
Why interviewers ask this: Analysts are communicators. You need to translate statistical jargon into business language. Interviewers want to see you can explain complex concepts simply without oversimplifying to the point of being wrong.
What makes a good answer: Avoid statistical jargon. Explain that p-value is the probability of observing this result by random chance if there’s actually no difference. A p-value of 0.03 means there’s only a 3% chance this result happened by luck—strong evidence for a real difference.
Better explanation: “If we ran this test 100 times when there’s actually no difference between versions, we’d see this result by random chance only 3 times. That’s pretty rare, so we have good evidence that Version B actually performs better than Version A.”
Question 18: A/B Test Design
You want to test whether a new checkout button design increases purchase rates. How would you design this test? What would you measure?
Why interviewers ask this: Practical experimental design matters. Interviewers want to see you can structure a proper test and avoid common mistakes. This tests both statistical thinking and product sense.
What makes a good answer:
- Random assignment to control (old) vs. treatment (new) groups
- Measure: conversion rate (purchases / visits) for each group
- Define success metric and sample size before running
- Run for same time period to avoid time-of-day or day-of-week biases
- Check for statistical significance (p-value < 0.05 is common threshold)
- Watch for multiple testing problem (don’t keep peeking at results)
Example metric:
- Baseline conversion rate: 5%
- If new design achieves 6%, that's a 20% improvement
- Run test for 2 weeks to get sufficient sample size
- Compare: conversion_rate_new vs. conversion_rate_control
- Statistical test: proportion z-test or chi-square test
💡 For career changers: “A/B testing is where analysis directly drives business decisions. Understanding how to design proper tests shows you think rigorously about decision-making.”
Question 19: Type I and Type II Errors
Explain Type I and Type II errors. Which is worse in a medical screening test context?
Why interviewers ask this: Tests if you understand the consequences of statistical decisions. Not all errors cost the same. Interviewers want to see you think about business implications.
What makes a good answer:
- Type I error: Rejecting a true null hypothesis (false positive: claiming an effect exists when it doesn’t)
- Type II error: Failing to reject a false null hypothesis (false negative: missing an effect that actually exists)
In medical screening: Type II error (missing disease) is typically worse—you might not treat someone who needs treatment. Type I (false positive) leads to unnecessary treatment but at least doesn’t ignore real disease.
In A/B testing: Type I error (claiming improvement when there’s none) might waste resources on a bad change. Type II error (missing real improvement) means you stay with an inferior version.
Question 20: Mean vs. Median
Your company’s sales team reports average (mean) deal size is \$50,000. But median is \$20,000. What does this tell you about the distribution?
Why interviewers ask this: Tests if you understand how outliers affect statistics. This is practical—someone is trying to mislead with mean, and you need to spot it.
What makes a good answer: The large gap between mean (\$50k) and median (\$20k) suggests the distribution is right-skewed with some very large deals pulling the mean up. Most deals are around \$20k, but a few large deals inflate the average. For understanding typical deal size, median is more representative.
This matters in real work: median salary, median house price, median customer lifetime value are often more meaningful than means because they’re less affected by outliers.
Question 21: Correlation vs. Causation
You notice website visitors who spend more time on your site have higher purchase rates. Can you conclude that spending more time causes higher purchase rates?
Why interviewers ask this: This is perhaps the most common analytical mistake. Interviewers want to see you think critically about claims, not just see a correlation and assume causation.
What makes a good answer: No—correlation doesn’t imply causation. Alternative explanations:
- Causation reversed: Higher interest (leading to purchases) causes people to spend more time
- Confounding variable: Mobile vs. desktop (mobile users might spend less time but also have lower purchase rates for unrelated reasons)
- Selection bias: High-intent visitors naturally spend more time and are more likely to buy
To test causation, you’d need an experiment (randomized time-on-site somehow), not just observation.
Python for Data Analysis (6 Questions)
Python skills matter for entry-level analysts. You’ll use it for data cleaning, exploratory analysis, and automation. These questions test whether you can write functioning code and understand when and why to use specific libraries. Interviewers want to see you’re comfortable with pandas and can handle real messy data, not just textbook examples.
Question 22: Reading and Cleaning Data with Pandas
Walk me through how you’d load a CSV, check for missing values, identify outliers, and prepare data for analysis.
Why interviewers ask this: A large chunk of time often goes to cleaning and validating data, not analyzing it, especially early in a project. Interviewers want to see you’re practical about data preparation. This tests your workflow, not just syntax.
What makes a good answer: Show a logical sequence: load, inspect, clean, validate. Explain each step’s purpose.
import pandas as pd
import numpy as np

# Load and inspect
df = pd.read_csv('sales_data.csv')
print(df.head())
print(df.info())  # Data types and missing values
print(df.describe())  # Detect outliers in distributions

# Check for missing values
print(df.isnull().sum())
print(df.isnull().sum() / len(df) * 100)  # Percentage missing

# Clean: remove rows missing critical data
df = df.dropna(subset=['customer_id', 'amount'])

# Fix data types
df['order_date'] = pd.to_datetime(df['order_date'])

# Remove obvious bad data
df = df[df['amount'] > 0]  # Remove negative/zero sales
df = df[df['order_date'] <= pd.Timestamp.today()]  # Remove future dates

# Detect outliers using IQR
Q1 = df['amount'].quantile(0.25)
Q3 = df['amount'].quantile(0.75)
IQR = Q3 - Q1
outliers = df[(df['amount'] < Q1 - 1.5*IQR) | (df['amount'] > Q3 + 1.5*IQR)]
print(f"Found{len(outliers)} outliers")

# Validate
print(df.describe())
print(f"Final dataset:{len(df)} rows")
💡 For career changers: “Data cleaning is tedious but critical. Hiring managers know this—they’re not expecting perfection, just that you have a systematic approach and know to validate your data before analysis.”
Question 23: Handling Missing Data
A dataset has a column with 15% missing values. How would you decide whether to drop or fill the missing values? Write code.
Why interviewers ask this: Missing data handling is never one-size-fits-all. Interviewers want to see your reasoning, not just a default approach. This tests judgment and understanding of consequences.
What makes a good answer: Explain the tradeoff: dropping loses data (15% is significant), filling makes assumptions. The right choice depends on context.
import pandas as pd

df = pd.read_csv('data.csv')

# First, understand the missingness
print(df['column_name'].isnull().sum())  # Count missing
print(df['column_name'].isnull().sum() / len(df) * 100)  # Percentage

# Option 1: Drop if missing is completely random or column is non-critical
df_dropped = df.dropna(subset=['column_name'])

# Option 2: Fill with statistical value if missing is random
df_filled = df.copy()
df_filled['column_name'].fillna(df_filled['column_name'].median(), inplace=True)

# Option 3: Fill with category-specific value if there's a pattern
df_filled['column_name'] = df_filled.groupby('category')['column_name'].transform(
    lambda x: x.fillna(x.median())
)

# Option 4: Create a flag for missing (might be informative)
df['column_name_is_missing'] = df['column_name'].isnull()
df['column_name'] = df['column_name'].fillna(-999)  # Placeholder value

# Best practice: Understand why data is missing
print(df[df['column_name'].isnull()].groupby('category').size())
Decision logic:
- If 15% is missing completely at random: probably safe to drop
- If missing is concentrated in certain groups: consider filling by group
- If missing might be informative (e.g., “customer didn’t provide phone”): create a flag
Question 24: Merging Data with Pandas
You have a customers table and an orders table. Write code to merge them and identify customers with no orders.
Why interviewers ask this: Merging tables is fundamental. This is the Python equivalent of SQL JOINs. Interviewers want to see you understand merge types (inner, left, outer).
What makes a good answer: Show the merge, explain the type chosen, then identify unmatched records.
import pandas as pd

customers = pd.read_csv('customers.csv')
orders = pd.read_csv('orders.csv')

# Merge with LEFT JOIN (keep all customers)
merged = pd.merge(
    customers,
    orders,
    on='customer_id',
    how='left',
    indicator=True  # Adds '_merge' column showing source
)

# Identify customers with no orders
customers_no_orders = merged[merged['order_id'].isnull()]
print(f"Found{len(customers_no_orders)} customers with no orders")

# Alternative: Show merge indicator
merge_summary = merged['_merge'].value_counts()
print(merge_summary)
# Output: both=X, left_only=Y (customers with no orders)
Merge types:
how='inner': Only matching records (like INNER JOIN)how='left': All from left table, matching from right (like LEFT JOIN)how='outer': All from both tables (like FULL OUTER JOIN)
💡 For career changers: “Merging in pandas is direct—you’re combining datasets just like in SQL. Master the merge types and you can handle most data combination tasks.”
Question 25: Top N Analysis
Write code to find the top 5 customers by total spending and show their order count and average order value.
Why interviewers ask this: Practical aggregation task. This tests your ability to group, aggregate, and sort—core analytical skills.
What makes a good answer: Group by customer, aggregate metrics, sort descending, take top 5.
import pandas as pd

orders = pd.read_csv('orders.csv')

# Aggregate by customer
customer_metrics = orders.groupby('customer_id').agg({
    'amount': ['sum', 'count', 'mean']
}).round(2)

# Flatten column names
customer_metrics.columns = ['total_spending', 'order_count', 'avg_order_value']
customer_metrics = customer_metrics.reset_index()

# Sort by total spending, get top 5
top_5_customers = customer_metrics.nlargest(5, 'total_spending')
print(top_5_customers)

# Alternative: using sort_values
top_5_alt = customer_metrics.sort_values('total_spending', ascending=False).head(5)
Question 26: Data Validation Function
Write a Python function that validates a dataset before analysis. It should check for required columns, data types, and reasonable value ranges.
Why interviewers ask this: Tests if you think systematically about data quality. Functions show you write reusable code. This is more advanced—shows professional practice.
What makes a good answer: A function that checks multiple validation rules and returns a report.
def validate_orders_dataset(df):
    """Validate orders dataset before analysis"""
    issues = []

    # Check required columns
    required_cols = ['customer_id', 'order_date', 'amount']
    missing_cols = [col for col in required_cols if col not in df.columns]
    if missing_cols:
        issues.append(f"Missing columns:{missing_cols}")

    # Check data types
    if df['order_date'].dtype != 'datetime64[ns]':
        issues.append("order_date should be datetime type")

    # Check value ranges
    if (df['amount'] < 0).any():
        issues.append(f"Found{(df['amount'] < 0).sum()} negative amounts")

    if (df['order_date'] > pd.Timestamp.today()).any():
        issues.append("Found future dates")

    # Check for excessive missing values
    null_pct = (df.isnull().sum() / len(df) * 100)
    if (null_pct > 20).any():
        high_null_cols = null_pct[null_pct > 20]
        issues.append(f"Columns with >20% missing:{high_null_cols.to_dict()}")

    # Report results
    if issues:
        print("VALIDATION ISSUES:")
        for issue in issues:
            print(f"  ⚠{issue}")
        return False
    else:
        print("✓ Dataset passed all validations")
        return True

# Usage
orders = pd.read_csv('orders.csv')
validate_orders_dataset(orders)
Question 27: Creating Visualizations
Write code to create a visualization showing revenue trend over time by product category.
Why interviewers ask this: Visuals communicate findings. Interviewers want to see you can go from data to insight to visual. This tests your understanding of chart types and data storytelling.
What makes a good answer: Use a line chart (good for trends), group by category, aggregate by time period.
import pandas as pd
import matplotlib.pyplot as plt

orders = pd.read_csv('orders.csv')
orders['order_date'] = pd.to_datetime(orders['order_date'])

# Aggregate by month and category
monthly_revenue = orders.groupby(
    [pd.Grouper(key='order_date', freq='M'), 'product_category']
)['amount'].sum().reset_index()

# Create line chart
plt.figure(figsize=(12, 6))
for category in monthly_revenue['product_category'].unique():
    data = monthly_revenue[monthly_revenue['product_category'] == category]
    plt.plot(data['order_date'], data['amount'], marker='o', label=category)

plt.xlabel('Month')
plt.ylabel('Revenue ($)')
plt.title('Monthly Revenue by Product Category')
plt.legend()
plt.grid(True, alpha=0.3)
plt.tight_layout()
plt.show()
Alternative using seaborn (cleaner):
import seaborn as sns

sns.lineplot(data=monthly_revenue, x='order_date', y='amount', hue='product_category')
plt.title('Monthly Revenue by Product Category')
plt.show()
Data Visualization & Storytelling (4 Questions)
Visualization bridges data and decisions. Interviewers want to see you understand that a chart isn’t just pretty—it’s about communicating findings clearly to decision-makers. These questions test your judgment about which visualizations serve which purposes.
Question 28: Choosing the Right Chart Type
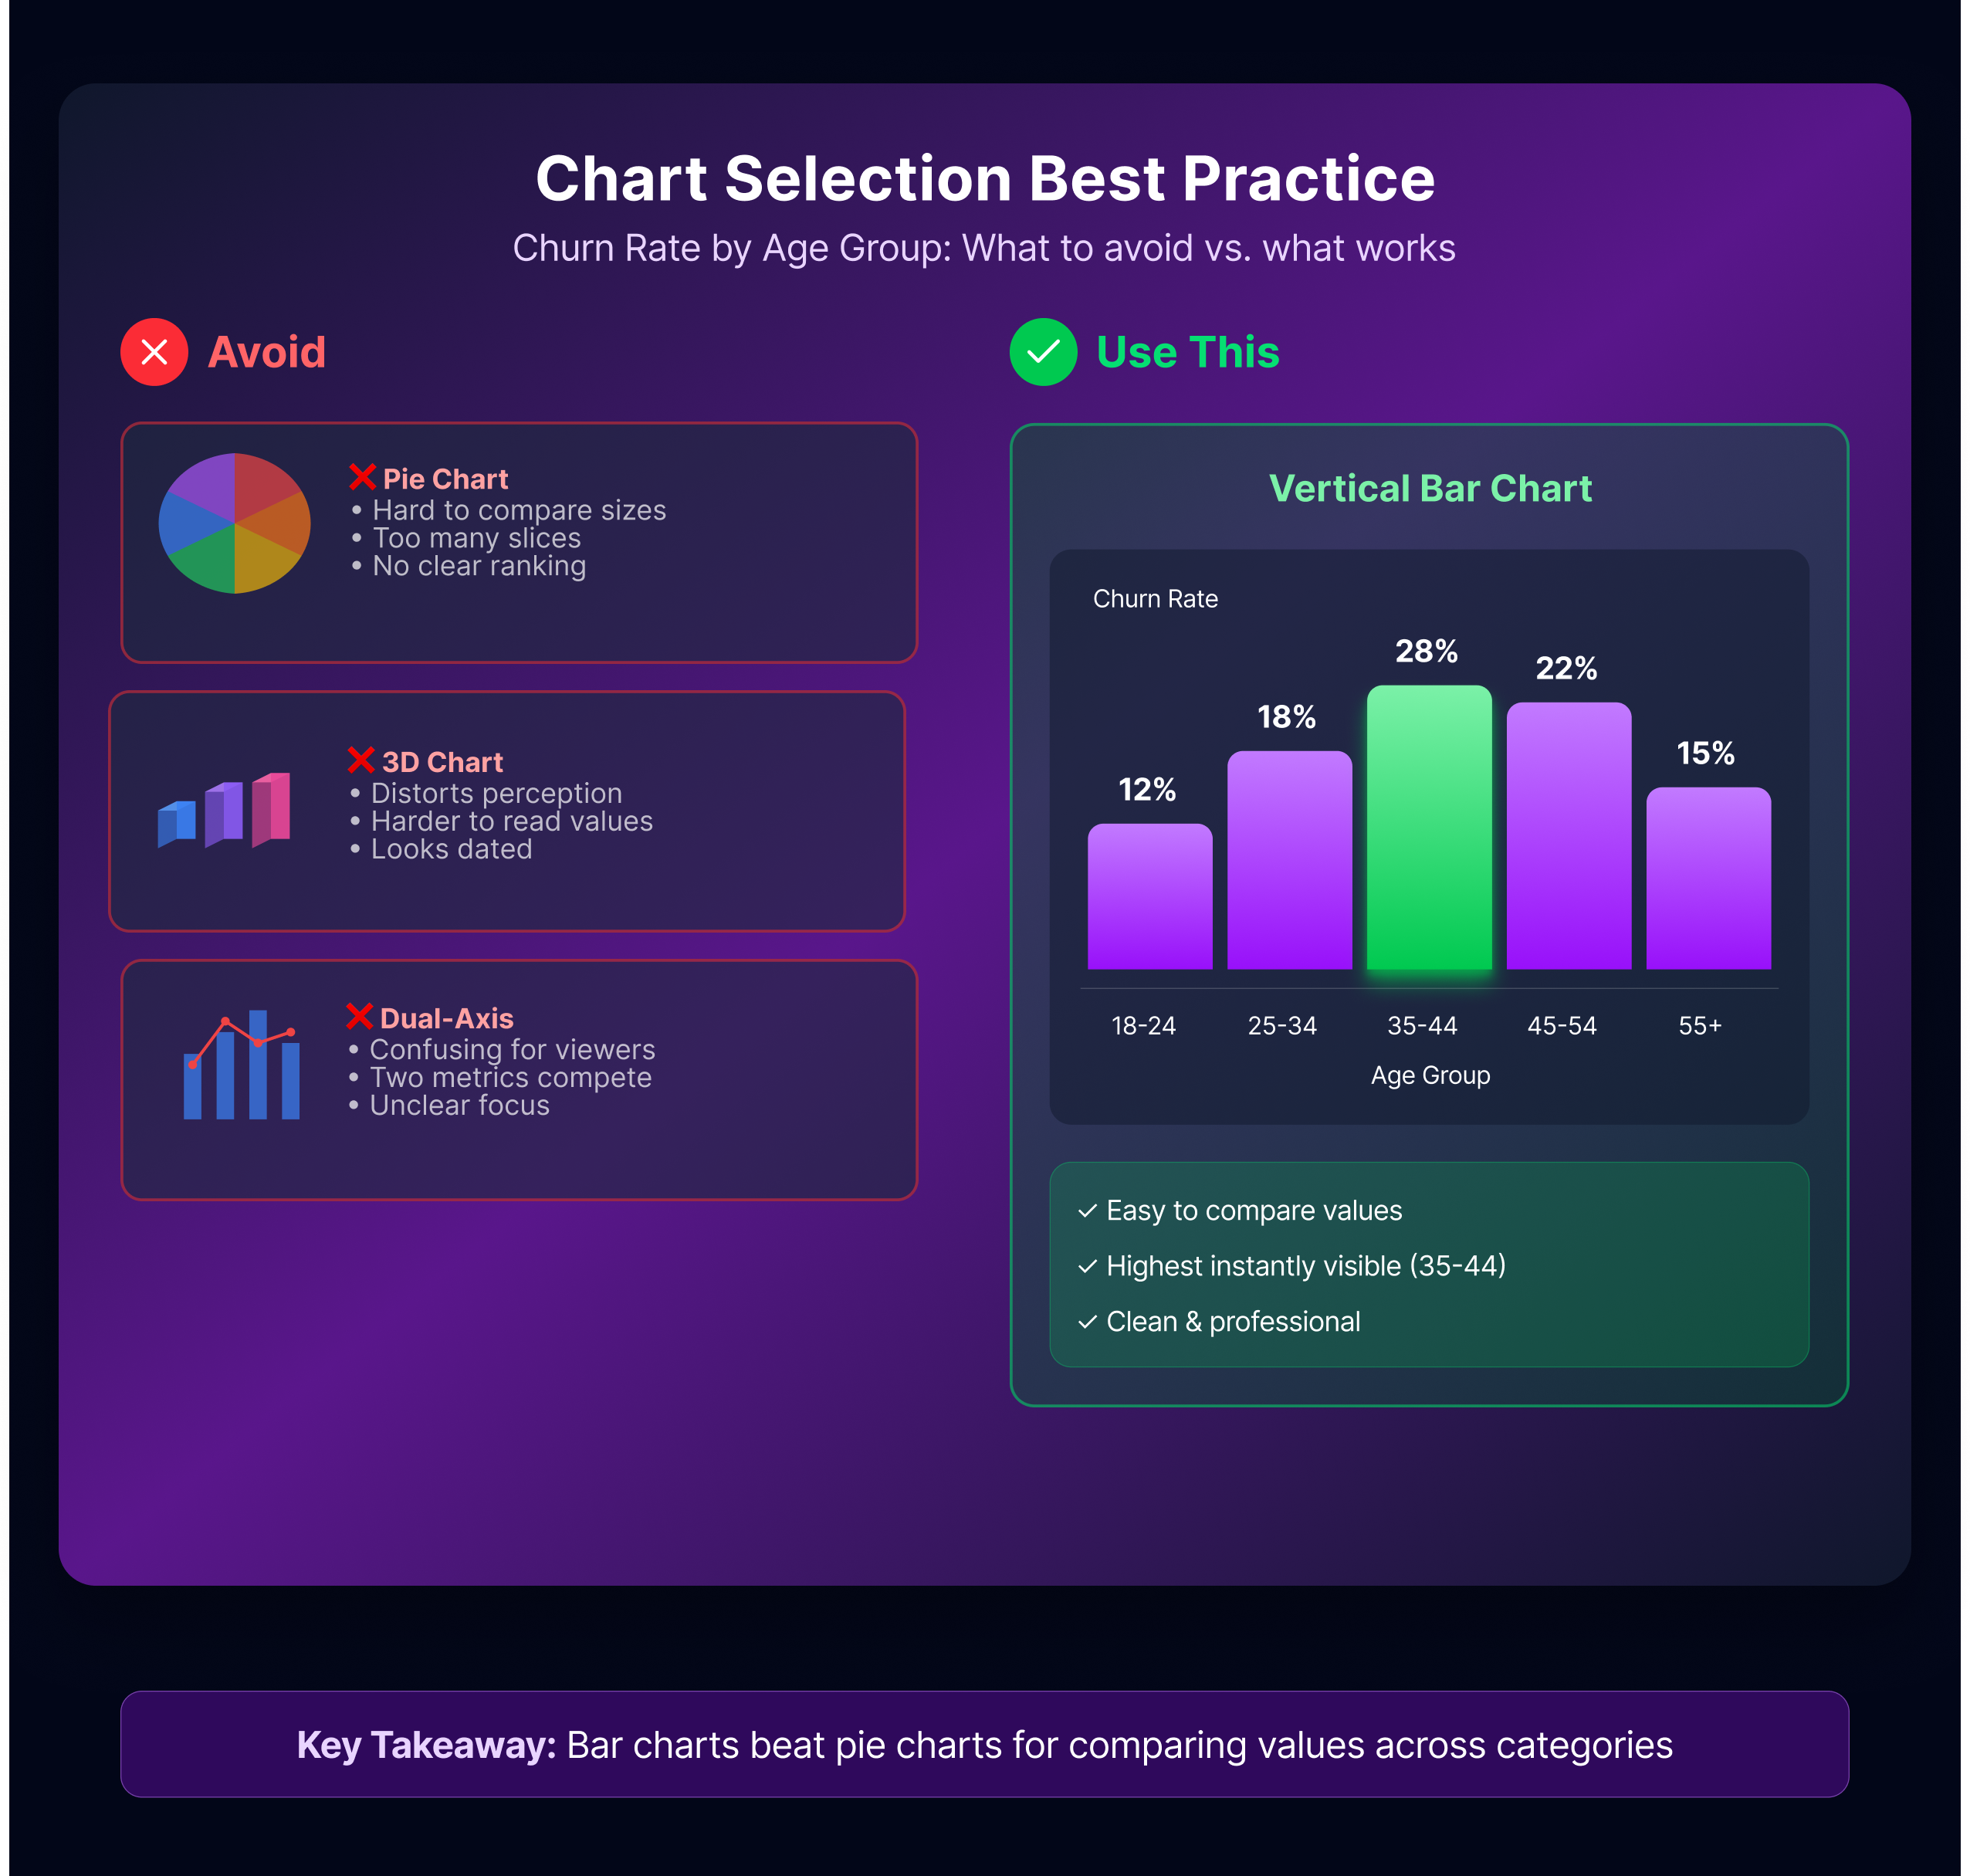
You’re analyzing customer churn by age group for non-technical stakeholders. What visualization would you use? Why?
Why interviewers ask this: Wrong chart = misunderstood data = bad decisions. Interviewers want to see you think about your audience and choose accordingly.
What makes a good answer: Bar chart grouped by age band. Explain your reasoning:
“I’d use a vertical bar chart with age groups on the x-axis and churn rate on the y-axis. Here’s why: bars make it easy to compare values across groups side-by-side. Age groups are categorical, bars handle that naturally. For non-technical stakeholders, simplicity matters—they can glance at the chart and understand the pattern immediately.”
Learn more from storytelling with data principles.
Question 29: Presenting Data to Non-Technical Audiences
You’ve completed analysis showing that Product A is declining. How would you present this to the CEO?
Why interviewers ask this: Communication matters as much as analysis. Interviewers want to see you can translate findings into business language.
What makes a good answer:
- Start with the conclusion, not the analysis (CEO’s attention is limited)
- Show the trend (visual)
- Quantify the impact (“We’re losing X% revenue”)
- Offer hypotheses or next steps (show you’re thinking about solutions)
Example: “Product A revenue is down 12% quarter-over-quarter. This represents \$500K in lost revenue. The decline accelerated in weeks 8-10. I’ve identified three likely causes [list them]. I recommend we [action]. Here’s what we need to investigate further.”
Question 30: Dashboard Design Principles
You’re designing a dashboard for the sales team to monitor daily performance. What metrics would you include? How would you organize them?
Why interviewers ask this: Dashboards are where analysis becomes operational. Interviewers want to see you think about what people actually need to see daily.
What makes a good answer:
- Lead with key metrics (revenue, deals closed, pipeline)
- Include trend indicators (up/down/flat)
- Organize by logical flow (what’s most important first)
- Use consistent colors (green for good, red for concerning)
- Avoid clutter (remove nice-to-haves)
Sample dashboard structure:
- Top: Key metrics with YTD comparison (revenue, deals, average deal size)
- Middle: Trend charts (daily revenue, pipeline growth)
- Bottom: Details (by salesperson, by region, by product)
Question 31: Critique a Visualization
[You’re shown a messy chart]. What’s wrong with this visualization? How would you improve it?
Why interviewers ask this: Teaches you to think critically about visualization design. You need to spot problems and explain fixes.
Common issues to identify:
- Misleading y-axis (doesn’t start at 0, exaggerates changes)
- Too many dimensions (cluttered)
- Poor color choice (hard to distinguish series)
- Missing labels or legend
- Wrong chart type for the data
Business Acumen & Case Studies (6 Questions)
Case study questions test if you can think like a business person using data. You’re not solving math problems. You’re investigating real business issues and making recommendations. These questions reveal whether you understand that analysis serves strategy, not the other way around. Interviewers want to see structured thinking: defining the problem, forming hypotheses, gathering evidence, drawing conclusions.
Question 32: Investigation Scenario
Revenue dropped 15% this month compared to last month. Walk me through how you’d investigate what happened.
Why interviewers ask this: Tests your structured approach to problem-solving. Interviewers want to see you don’t panic and jump to conclusions—you methodically narrow scope and test hypotheses.
What makes a good answer: Start with clarifying questions, then narrow scope systematically.
“First, I’d clarify: Is this drop across all products or concentrated in specific ones? All customers or certain segments? All geographies? This helps narrow the scope quickly.
Then I’d segment the data to find the source: By product (which products declined?), by customer type (enterprise vs. SMB), by channel (direct vs. reseller), by geography. I’d compare this month to last month AND to the same month last year (is this seasonal?).
Once I identify what changed, I’d form hypotheses: Did we lose major customers? Did prices drop? Did marketing spend decrease? Did competition increase? I’d test each hypothesis with data.
Finally, I’d communicate findings clearly: not ‘revenue dropped 15%’ but ‘enterprise customers declined 20% while SMB grew 5%, net impact 15%. We lost three major contracts. Recommended actions: [list]’”
Question 33: KPI Selection
Your company wants to measure product adoption success. What metrics would you track and why?
Why interviewers ask this: Tests if you understand what metrics actually matter vs. vanity metrics. This is strategic thinking.
What makes a good answer:
- Depth: “adoption rate” alone isn’t enough. Break it down.
- Actionability: Metrics should guide decisions, not just report activity.
- Balance: Lead indicators (activity) and lag indicators (outcomes).
Sample for product adoption:
- Activation: % of signups that complete onboarding (lead indicator)
- Usage: Monthly active users, feature adoption rate (engagement)
- Retention: % of users active 30/60/90 days after signup (stickiness)
- Expansion: % of users upgrading or increasing usage (monetization)
- Churn: % dropping off per month (problems)
Question 34: Product Feature Success
You released a new feature. How would you measure whether it’s successful?
Why interviewers ask this: Tests if you think about cause and effect. Success depends on your goal, and you need to define it first.
What makes a good answer:
- Define success first: Are we trying to increase engagement? Revenue? Customer satisfaction?
- Identify metrics tied to that goal
- Set baseline (what was happening before?)
- Compare: Did we improve?
Example: “If the goal is increasing engagement: I’d measure daily active user % before and after, time spent per session, feature adoption rate (% of users who tried it). We’d run an A/B test with random assignment—half users get the feature, half don’t. After 4 weeks, compare metrics. If engagement improved significantly in treatment group and not in control, the feature worked.”
Question 35: Stakeholder Disagreement
Two leaders disagree on whether a metric improved. One says yes, one says no. How would you resolve this?
Why interviewers ask this: Tests your diplomacy and analytical rigor. Real work involves navigating conflicting opinions.
What makes a good answer:
- Ask clarifying questions: What metric are we discussing? What time period?
- Show the data transparently: Graph it, show the numbers
- Consider context: Is the improvement statistically significant? Seasonally normal?
- Offer nuance: “Metric A improved 3% but it’s within normal variance. Metric B, which we care more about, declined 8%.”
This often reveals they’re looking at different metrics or time periods. Your job is to bring clarity, not take sides.
Question 36: Data Request Workflow
A department head asks for a complex analysis that seems potentially misleading. How do you handle it?
Why interviewers ask this: Tests your integrity and judgment. Good analysts push back on bad requests.
What makes a good answer:
- Don’t assume bad intent—they might not understand the implications
- Ask questions: “What decision will this analysis support?”
- Explain the issue: “If we look at it that way, we’re missing seasonality, which makes the conclusion wrong”
- Offer alternatives: “Here’s what I’d recommend instead, and here’s why it’s more accurate”
Example: “Sure, I can calculate that. But before I do, can you help me understand what you’re trying to learn? Because this approach would exclude Q1 data, which might hide important trends. What if we looked at [alternative approach] instead? That would give you the insight you need without the blind spot.”
Question 37: Guesstimate Question
How many Starbucks are there in New York City? (Or similar: How many customers does our company lose per month? How much data does our database store?)
Why interviewers ask this: Tests your estimation skills and reasoning under uncertainty. There’s no perfect answer—they want to see your logic.
What makes a good answer: Break the problem into smaller pieces.
“For Starbucks in NYC, I’d estimate:
- NYC population: ~8 million
- Not everyone drinks coffee, but office workers and tourists do. Maybe 40% are regular coffee drinkers = 3.2 million
- Average coffee drinker visits a coffee shop 5x per week = 16 million visits/week
- Average Starbucks does maybe 1,000 visits/week (rough guess based on location type)
- 16 million / 1,000 = 16,000 Starbucks needed… wait, that’s too high. Let me reconsider.
Actually, maybe average is higher—2,000 visits/week per store in busy areas: 16M / 2,000 = 8,000 Starbucks? Still seems high. Let me reality-check: NYC has about 300 Starbucks, so my estimate is way off. Where did I go wrong?
Ah—most people don’t drink coffee daily, and many go to local shops. Maybe 10% of the population are frequent Starbucks visitors = 800K. 5 visits/week = 4M visits/week. 4M / (2,000 per store) = 2,000 stores—still high, but closer.”
The point is showing your thinking, not being right.
Behavioral Questions (6 Questions)
Behavioral questions reveal how you think, react to challenges, and collaborate. Interviewers are assessing fit and maturity. These aren’t trick questions. They want to understand who you are as a professional.
Question 38: Tell Me About Yourself
Give your 90-second introduction.
Why interviewers ask this: First impression matters. They want to understand your background, why you’re in data, and what you’re looking for.
What makes a good answer: Structure it as: background → why data → relevant skills → what you’re seeking. Keep it to 90 seconds.
“I spent three years in marketing at [company], where I got increasingly interested in the data behind our campaigns. I realized I loved the analytics part more than the creative work—figuring out what worked and why. So I decided to transition into data analysis formally. I completed Dataquest’s Data Analyst path, which covered SQL, Python, and statistics. I built three portfolio projects [briefly describe], and I’m excited to land a role where I can answer real business questions with data. I’m specifically interested in [company] because [genuine reason].”
Question 39: Describe a Data Project That Surprised You
Tell me about a time when analysis revealed something unexpected.
Why interviewers ask this: Tests if you’re actually doing analysis or just following instructions. Curiosity matters. You don’t need professional experience—a portfolio project counts.
What makes a good answer: Tell a real story with setup, discovery, and outcome.
“In my Dataquest course, I analyzed [dataset] looking for patterns in [question]. My hypothesis was X would drive Y, but the data showed the opposite. Z was the actual driver. It surprised me because [why you expected differently]. It made me realize I should always check my assumptions against data instead of assuming they’re right. I then used this insight to [action you took], which improved [outcome].”
Question 40: Stakeholder Disagreement
Tell me about a time when your analysis disagreed with what a stakeholder wanted to hear. How did you handle it?
Why interviewers ask this: Tests integrity and communication under pressure. This separates analysts who tell the truth from those who tell people what they want.
What makes a good answer: Show you stood your ground professionally without being difficult.
“In my previous role, I analyzed [situation] and found the results contradicted what the manager expected. Instead of just presenting the numbers, I met with them first to understand what they were hoping to find and why. I then walked through my methodology transparently, showed the data multiple ways, and explained why my conclusion was solid. I also offered hypotheses for why they expected something different—‘Maybe you were thinking of [different metric]?’—and we often found we were answering different questions. By the end, they understood and respected the analysis more than if I’d just agreed with them.”
Question 41: Prioritizing Requests
You have three urgent data requests from different departments due tomorrow. How do you prioritize?
Why interviewers ask this: Tests judgment and communication skills. Real work is about prioritizing, not doing everything perfectly.
What makes a good answer: Don’t say “I’d do all three perfectly.” Say:
“I’d first clarify the real urgency and impact of each: Which decision are they supporting? What’s the actual deadline? Some ‘urgent’ requests can wait. Then I’d prioritize by business impact: Which one supports the biggest decision? I’d commit to delivering 80% on that one by tomorrow, and let the other requesters know a solid analysis takes longer—either give them partial results tomorrow and full results in two days, or ask which of the three is most critical and focus there. I’d communicate transparently instead of overpromising and under-delivering.”
Question 42: Learning New Tools Quickly
We use [tool you haven’t used]. How would you approach learning it quickly?
Why interviewers ask this: No one knows everything. They want to see you’re eager to learn and methodical about it.
What makes a good answer: Show a practical learning approach: documentation, tutorials, hands-on practice, asking colleagues.
“I’d start with the official documentation or [well-regarded tutorial], working through it hands-on, not just reading but doing. I’d then find a small real project to practice on, because that’s where learning sticks. I’d ask the team how they typically use [tool] for common tasks: not to slow down, but to avoid re-inventing the wheel. And I’d set a timeline: ‘I’ll be productive with this within a week, confident in a month.’ That communicates I take learning seriously but also set realistic expectations.”
Question 43: Handling a Mistake
Tell me about a time when analysis you did was wrong or missed something important. How did you handle it?
Why interviewers ask this: Maturity is admitting mistakes. Perfect analysts don’t exist. They want to see you own failures and learn.
What makes a good answer: Don’t say “I never make mistakes.” Do say:
“I once presented analysis to leadership that I didn’t fully validate. I relied on one data source and didn’t cross-check against another. It turned out there was a data quality issue in my source, and my conclusion was wrong. I felt terrible, but I immediately told the stakeholder what I’d found, apologized for the error, ran the analysis correctly, and updated my recommendation. From then on, I built validation checks into my process—comparing across sources, checking for anomalies, flagging assumptions. That mistake taught me the importance of skepticism and verification.”
This shows you: learn from mistakes, take responsibility, prevent recurrence.
Questions to Ask Your Interviewer
Good candidates ask thoughtful questions. This shows genuine interest and helps you evaluate fit.
“What does your data stack look like?” — Reveals whether they use BigQuery, Snowflake, legacy databases, or something else.
“What’s the biggest data challenge your team is facing right now?” — Shows their actual problems, not just what the job posting said.
“How do you measure success in this role?” — Clarifies expectations. Is it dashboard delivery? Data quality? Enabling better decisions?
“What tool do you use for visualization—Tableau, Power BI, Looker?” — Tells you what to focus on post-hire.
“How does the data team interact with other departments?” — Reveals whether analysts are siloed or embedded.
Getting Started: Your Interview Prep Strategy
You don't need months of prep to feel confident in interviews. Most candidates see real improvement within 4 weeks of focused, deliberate practice. The key is knowing what to prioritize each week.
This timeline concentrates on the skills that appear most in interviews, builds from foundational (SQL) to advanced (case studies), and includes behavioral prep so you can think clearly under pressure.
Week 1: SQL Deep Dive
Practice the 15 SQL questions daily with real datasets from Kaggle. Don’t just read solutions—write code, run it, break it intentionally, fix it. Time yourself. Speed under pressure matters.
Week 2: Python + Statistics
Review pandas fundamentals. Practice reading CSVs, cleaning data, basic aggregations. Understand statistical concepts conceptually—you don’t need to calculate by hand, but you need to explain p-values and confidence intervals to non-statisticians.
Week 3: Case Studies + Portfolio Polish
Solve mock case studies. Clean up your portfolio projects. Add clear README files explaining your methodology. Link to Dataquest’s project showcase for reference on presentation quality.
Week 4: Behavioral Prep + Practice Interviews
Practice your “tell me about yourself” answer. Do mock interviews with friends or mentors. The first few real interviews will feel awkward—expect that. By your fifth interview, you’ll be much more comfortable.
Key Takeaways
You don’t need to memorize every function. You need to understand core concepts and know how to think through problems. Even analysts with 10+ years of experience Google syntax during interviews. What matters is your approach.
SQL is non-negotiable. The 15 SQL questions cover the topics that appear in 85% of interviews. Master these patterns and variations, then practice applying them to business problems.
Interview stress is normal. Smart people with advanced degrees freeze under pressure. If you forget syntax, you’re not alone. You’re in excellent company.
The job search is a numbers game. Apply broadly. Expect ghosting and rejection. Position Dataquest’s Data Analyst path as improving your preparation, not as a guarantee. You’re ready sooner than you think.
Start interviewing once you can confidently solve the entry-level SQL questions and articulate your thinking clearly. You don’t need perfection—you need 50-75% mastery and genuine interest in the role.