xlwings Tutorial: Make Excel Faster Using Python
Excel is very, very pervasive in today's businesses. At Dataquest, we generally recommend working with code for quite a few reasons, and many of our data science courses are aimed at teaching efficient coding for data analysis and data science. But no matter how strongly you prefer working with Python, at the end of the day there is sometimes a need to present your findings or share your data using Excel.
But that doesn't mean can't still enjoy some of the efficiencies of Python! In fact, using a library called xlwings, you can use Python to make working in Excel faster.
In this xlwings tutorial, we'll walk through how to use Python in Excel to execute and use some common operations like deleting rows based on certain criteria, using Excel functions and formulas, autofilling, creating sheets, charts, etc. In order to follow this post you should be familiar with basic Python concepts (objects, methods, attributes, functions) and Python's syntax and have an intermediate knowledge of Excel and VBA.
We will be working with a data set that contains information regarding the draws of an European lottery called EuroMillions. This data set was downloaded from this link and it contains all the EuroMillions draws up to, and including, the 20th of September. The data available at that link should be updated with the latest information up to whenever you're reading this post, but in case it's unavailable, here's a CSV file with the data from that link as of September 20.
Euromillions is a multinational lottery available in some European countries, specifically in Andorra, Austria, Belgium, France (including overseas regions and collectivities), Ireland, the Isle of Man, Liechtenstein, Luxembourg, Monaco, Portugal, Spain, Switzerland and the United Kingdom (source).
As of this writing, the draw consists of five numbers from a pool of 50 numbers (numbered 1 through 50) and two numbers called lucky stars from a pool of 12 numbers. In order to win the jackpot, participants must correctly choose all drawn numbers and lucky stars. The largest jackpot ever won was €190 million. (Note, though, that our data set denominates winnings in Pounds, not Euros).
In this tutorial, we'll use Python and xlwings with Excel to clean up a data set and then generate some graphs to visualize which numbers win the EuroMillions most frequently.
import pandas as pd
import xlwings as xw
df = pd.read_csv('euromillions.csv')
df.sample(5)
| No. | Day | DD | MMM | YYYY | N1 | N2 | N3 | N4 | N5 | L1 | L2 | Jackpot | Wins | |
|---|---|---|---|---|---|---|---|---|---|---|---|---|---|---|
| 627 | 514 | Fri | 24 | Aug | 2012 | 6 | 5 | 19 | 37 | 12 | 7 | 3 | 37709047 | 1 |
| 230 | 911 | Tue | 14 | Jun | 2016 | 13 | 50 | 42 | 39 | 34 | 11 | 9 | 11928000 | 0 |
| 998 | 143 | Fri | 3 | Nov | 2006 | 13 | 11 | 44 | 24 | 49 | 9 | 3 | 88344099 | 0 |
| 1071 | 70 | Fri | 10 | Jun | 2005 | 37 | 32 | 47 | 7 | 6 | 7 | 1 | 21734699 | 0 |
| 522 | 619 | Tue | 27 | Aug | 2013 | 7 | 40 | 38 | 43 | 30 | 6 | 2 | 12931500 | 0 |
The first column is the draw number, columns N1-L2 are the drawn numbers and lucky stars (by the order they were drawn), the Jackpot column is the jackpot in Euros and the Wins column tell us how many bets hit the jackpot.
Meet xlwings
xlwings is a Python library that makes some of the data analysis features of Python available in an Excel instance, including support for numpy arrays and pandas Series and DataFrames. Like any other Python library, it can be installed using common methods like pip or conda, but you can access the documentation for xlwings here if you need additional details.
Note that you'll need to have a version of Microsoft Excel installed on the computer you're using to do this xlwings tutorial.
xlwings objects
In xlwings there are four main object types which are, in decreasing hierarchical order: App (which represents an Excel instance), Book, Sheet and Range. In addition to these we'll also be dealing with Chart and Shape objects. You can find useful information regarding these and other objects in the official documentation, but we'll be looking at each of these objects one at a time.
Let's start by creating a Book instance and naming it wb (workbook).
wb = xw.Book() # wb = xw.Book(filename) would open an existing file
When you run that code, it should look something like this.
Notice that when the code cell is run in the Jupyter Notebook, Excel is launched automatically.
By instantiating a Book object, an App object that belongs to our book object is created automatically. Here's how we can check all opened Excel instances.
Note: we're not going to include gifs for every step of this tutorial, because we don't want this page to be a hassle to load for people with slow or limited internet connections. However, subsequent code-running steps should look similar to what we can see above: when we run a cell in Juypter, the Excel spreadsheet is updated in accordance with whatever code we've run.
print(xw.apps)
Apps([<Excel App 9536>])
The object xw.apps is an iterable. To check what workbooks belong to the unique instances in this iterable we can invoke the books method on it like so.
print(xw.apps[0].books)
Books([<Book [Book1]>])
As expected the only instance of this iterable is the workbook wb. We check this fact below.
print(xw.apps[0].books[0] == wb)
True
Similarly, we can check what sheets belong to this workbook:
print(wb.sheets)
Sheets([<Sheet [Book1]Sheet1>])
We can also refer to sheets by their name:
#creates a worksheet object assigns it to ws
ws = wb.sheets["Sheet1"]
#checks that wb.sheets[0] equals ws
print(ws == wb.sheets[0])
True
Sheet objects have a name attribute that works as expected. Let us change the name of our only sheet.
ws.name = "EuroMillions"
We can move data from certain Python objects (e.g. lists and tuples) into Excel. Let's move the data in our dataframe into the sheet EuroMillions. To do this, we'll make use of range to create a range object that stores the data from our DataFrame in a range of cells in Excel, starting in this case with the cell A1:
#ws.range("A1") is a Range object
ws.range("A1").value = df
Here's how that will look:
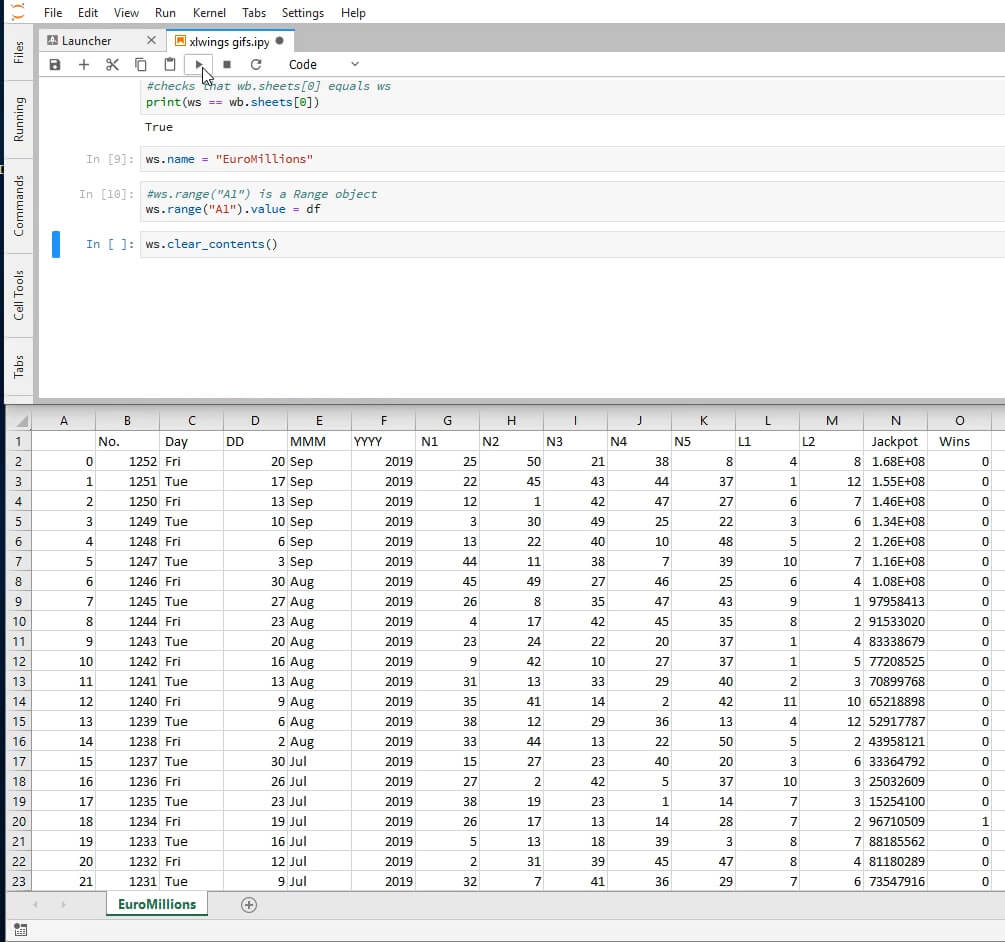
As we can see, the index column of df was also moved to Excel. Let's clear the contents of this sheet and copy the data without the index.
ws.clear_contents()
ws.range("A1").options(index=False).value = df
It will be useful to be able to tell where our table ends. More specifically, we'll need the last row that has data in it. To this end, we can use the end method and the row attribute of Range objects.
The row method, not surprisingly, returns the row of the Range object.
The method end takes in as an argument a direction ("up" (or 1), "right" (or 2), "left" (or 3, "down" (or 4)) and returns another range object. It mimics the very common action in Excel CTRL+Shift+Arrow.
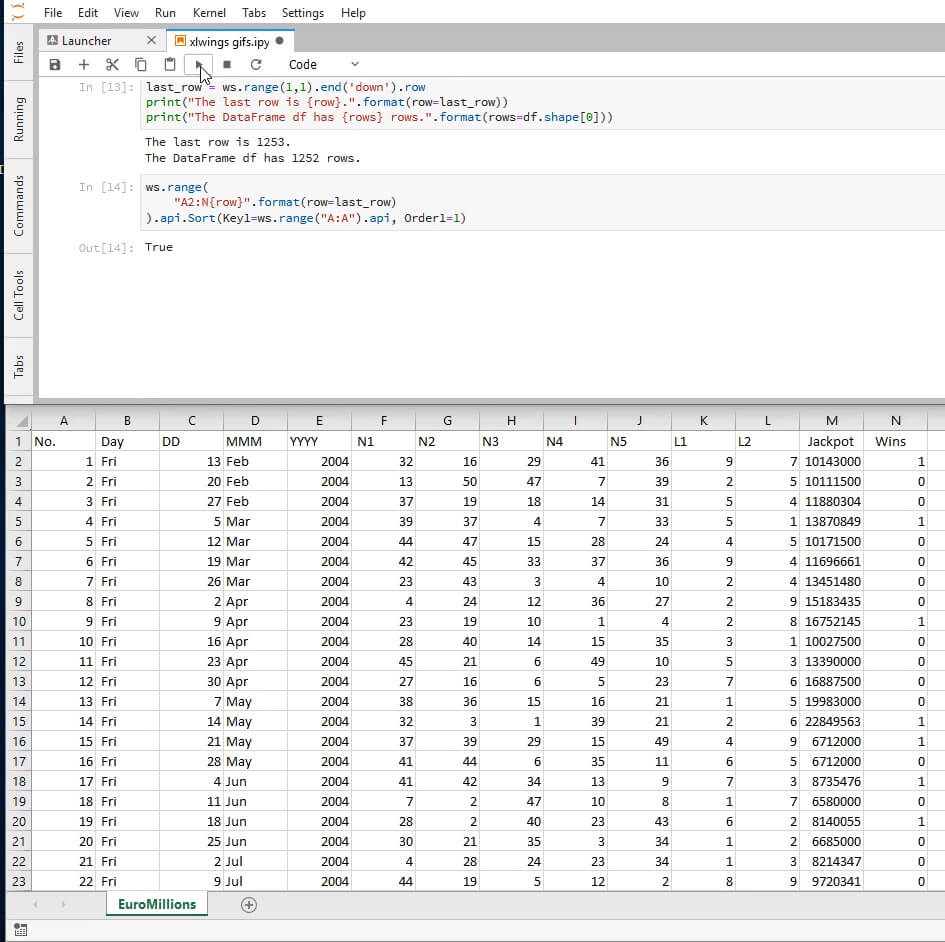
last_row = ws.range(1,1).end('down').row
print("The last row is {row}.".format(row=last_row))
print("The DataFrame df has {rows} rows.".format(rows=df.shape[0]))
The last row is 1142.
The DataFrame df has 1141 rows.
It checks out!
The API property
Not every Excel functionality is available as a native xlwings feature. Sometimes we'll have to find workarounds to do what we want. Fortunately xlwings makes this very easy for us. From the Missing Features section in the official documentation:
Workaround: in essence, xlwings is just a smart wrapper around pywin32 on Windows and appscript on Mac. You can access the underlying objects by calling the api property. The underlying objects will offer you pretty much everything you can do with VBA, using the syntax of pywin32 (which pretty much feels like VBA) and appscript (which doesn’t feel like VBA). But apart from looking ugly, keep in mind that it makes your code platform specific (!). Excel Visual Basic for Applications is a rich source of explanations for the various existing Excel objects.
Sorting is one such functionality that is missing from xlwings. You may have noticed that the records are ordered from the most recent to the oldest draw. In the next few steps we'll be reversing the order.
The object ws.range("A2:N{row}".format(row=last_row)) is a Range object. Appending the api property to it yields a VBA Range object which in turn gives access to its VBA features.
We'll be using the Sort property of this VBA object. In its simplest application, Sort takes in two arguments: the column by which we want to order the table (as a VBA Range object), and the order type (whether we want to sort it in ascending or descending order). The second argument's parameter's documentation can be seen here. We'll be sorting in ascending order.
Putting all of that together looks like this:
ws.range(
"A2:N{row}".format(row=last_row)
).api.Sort(Key1=ws.range("A:A").api, Order1=1)
True
Here's how it'll look on your screen after running (note that the first column has changed, and it's now sorted in ascending rather than descending order.
Analyzing Our Data
One problem we'll encounter in trying to analyze this data set is that the dates are scattered across three different columns. We'll need to compress it into a single column. To do this, we'll concatenate the columns appropriately in Excel, using Python. We begin by inserting a header in the empty adjacent column.
ws.range("O1").value = "Date"
Next, we can insert the Excel formula we want to use as a string. Note: the specifics of what argument separator you should use depends on your machine's local regional settings. On mine, the argument separator is a comma and that's what I've used in this tutorial, but on yours it might be a semicolon.
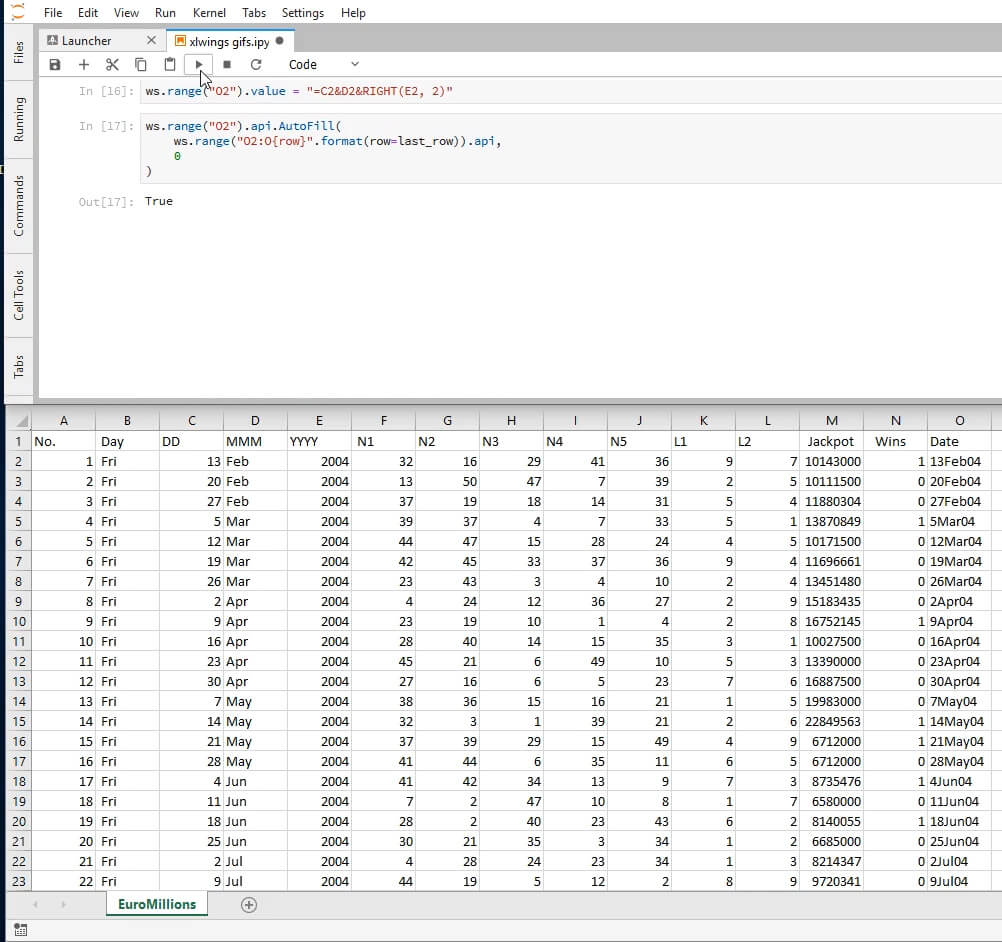
ws.range("O2").value = "=C2&D2&RIGHT(E2, 2)"
Having inserted the formula in the first cell, it's second nature in the regular Excel workflow to autofill the rest of the cells through the end of the table. Autofill is a method of the VBA Range object. It takes as parameters the destination cells as a VBA Range object and the type of fill. We're interested in the default one whose enumeration is 0.
ws.range("O2").api.AutoFill(
ws.range("O2:O{row}".format(row=last_row)).api,
0
)
True
Here's roughly how the screen should look after this step; note the new "Date" column on the far right.
We can also use the named form of the type of fill we want. To do this we'll need to retrieve it from the module xlwings.constants which contains named versions of the enumerated arguments of most VBA properties. Recall that you can always check the available attributes by printing dir(xlwings.constants).
(If you're not familiar with it, dir is a native Python function and can take several kinds of arguments (modules, classes and regular objects (like lists and strings). For example, if you print dir(some_list) it will give you all the methods and attributes that you can use with a list.)
What we did above could also be achieved with the following code snippet.
from xlwings.constants import AutoFillType
ws.range("O2").api.AutoFill(
ws.range("O2:O{row}".format(row=last_row)).api,
    AutoFillType.xlFillDefault
)
Since we'll be using this often, we'll create a function that applies the default fill, given:
- a worksheet
- a string representing a cell in the worksheet
- a last row to fill.
To do this we'll introduce a new Range method called get_address. It takes in four Boolean arguments and returns a string that identifies the range with varying levels of detail. Here's a hopefully enlightening illustration of this method.
for arg4 in (0, 1):
for arg3 in (0,1):
for arg2 in (0,1):
for arg1 in (0,1):
print(ws.range("O2").get_address(arg1, arg2, arg3, arg4))
O2
O$2
$O2
$O$2
EuroMillions!O2
EuroMillions!O$2
EuroMillions!$O2
EuroMillions!$O$2
[Book1]EuroMillions!O2
[Book1]EuroMillions!O$2
[Book1]EuroMillions!$O2
[Book1]EuroMillions!$O$2
[Book1]EuroMillions!O2
[Book1]EuroMillions!O$2
[Book1]EuroMillions!$O2
[Book1]EuroMillions!$O$2
And now we define our function.
def autofill(worksheet, cell, last_row):
   rg_cell = worksheet.range(cell)
   to_fill = "{col}{top_row}:{col}{last_row}".format(
      col=rg_cell.get_address(0,0)[0],
      top_row=rg_cell.row,
      last_row=last_row
   )
   rg_cell.api.Autofill(worksheet.range(to_fill).api, 0)
In order to save Excel from making unnecessary computations, we'll replace the formulas we just inserted on column O with hard coded values. Before we do this let us take a moment to think about what kind of Python object is Range.value when Range is an array.
print(type(ws.range("O2:O{row}".format(row=last_row)).value))
<class 'list'>
It's a list! Let's see its first ten elements.
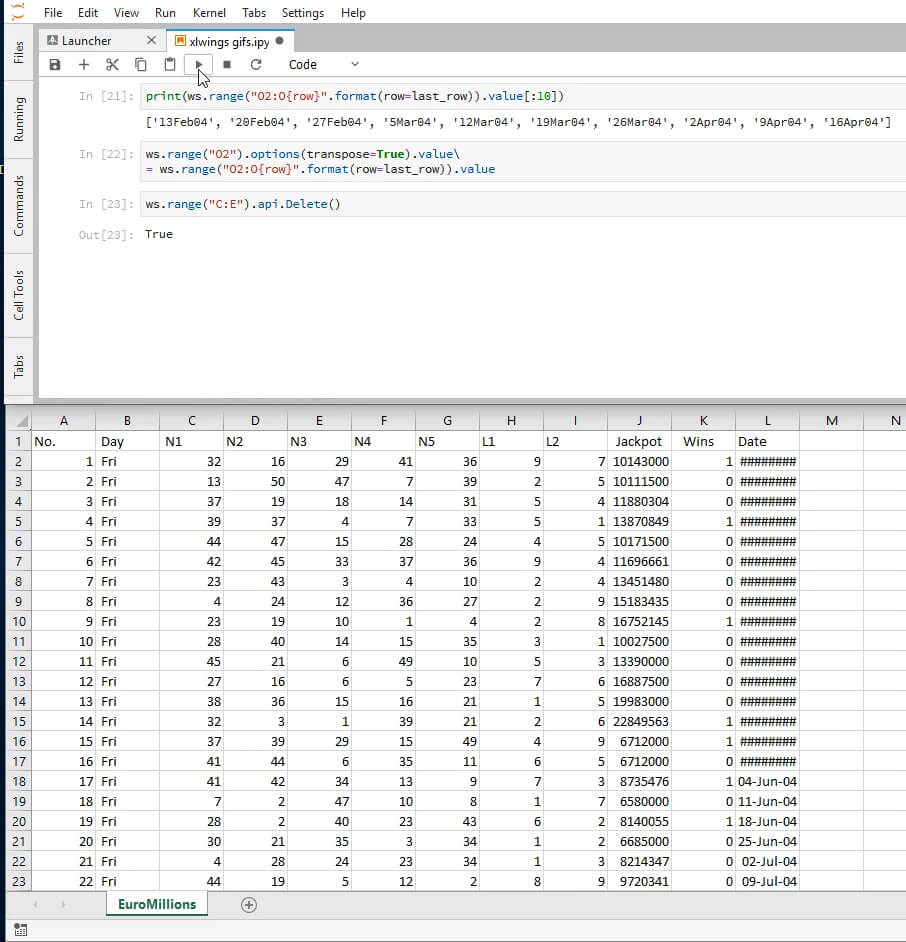
print(ws.range('O2:O{row}'.format(row=last_row)).value[:10])
['13Feb04', '20Feb04', '27Feb04', '5Mar04', '12Mar04', '19Mar04', '26Mar04', '2Apr04', '9Apr04', '16Apr04']
If we insert this list into any range, it will place the values horizontally, which isn't what we want. In order to place them vertically, we'll need to use the options method of Range objects with the option transpose=True as a parameter, like this:
ws.range('O2').options(transpose=True).value\
= ws.range('O2:O{row}'.format(row=last_row)).value
And we can now delete columns C through E.
ws.range('C:E').api.Delete()
True
EuroMillions format has suffered some mild modifications over the years, the last one happened on September 24, 2016.
From September 24, 2016 the amount of lucky stars changed from a pool of 11 to a pool of 12 numbers. In order to make a meaningful analysis, we'll only consider draws that occurred after the last modification. The next code snippet finds the last game that happened prior to the modification and names it to_delete.
import datetime

for day in ws.range('L2:L{}'.format(last_row)):
# checks if day is not prior to the change of the rules
    if day.value <= datetime.datetime(2016, 9, 24, 0, 0):
        # since day is past the modification date,
        # the row we want is the previous one, hence minus 1
        to_delete = int(day.get_address(0, 0)[1:])-1
        # leave the for cycle
        break
And we can now delete every row from the first game to to_delete.
ws.range('2:{}'.format(to_delete)).api.Delete()
True
Here's where we're at, at this point:
Having finished preparing the data, we will now format this table. We'll begin by setting the font of the first row to bold.
ws.range('1:1').api.Font.Bold = True
We can follow that by formatting the Jackpot column in millions. Note that the string format below depends on your machine's local regional settings. If the format looks odd on your end, try swapping the commas with the dots. More on Excel custom formats here.
ws.range('J:J').number_format = "£##.##0,,' M'"
As an auxiliary step for what will follow, we'll find the letter corresponding to the last column that has data.
last_column = ws.range(1,1).end('right').get_address(0,0)[0]
Let's now add a border to the bottom of the header cells. Similarly to what we have been doing, we'll use the api property. Additionally we are going to need the Border property of Range objects, the border orientation enumeration and the style of the border. We'll be setting a double edged border (line style -4119) on the bottom of the header cells only (orientation 9).
ws.range('A1:{}1'.format(last_column)).api.Borders(9).LineStyle = -4119
Let us now autofit by both rows and columns.
ws.autofit()
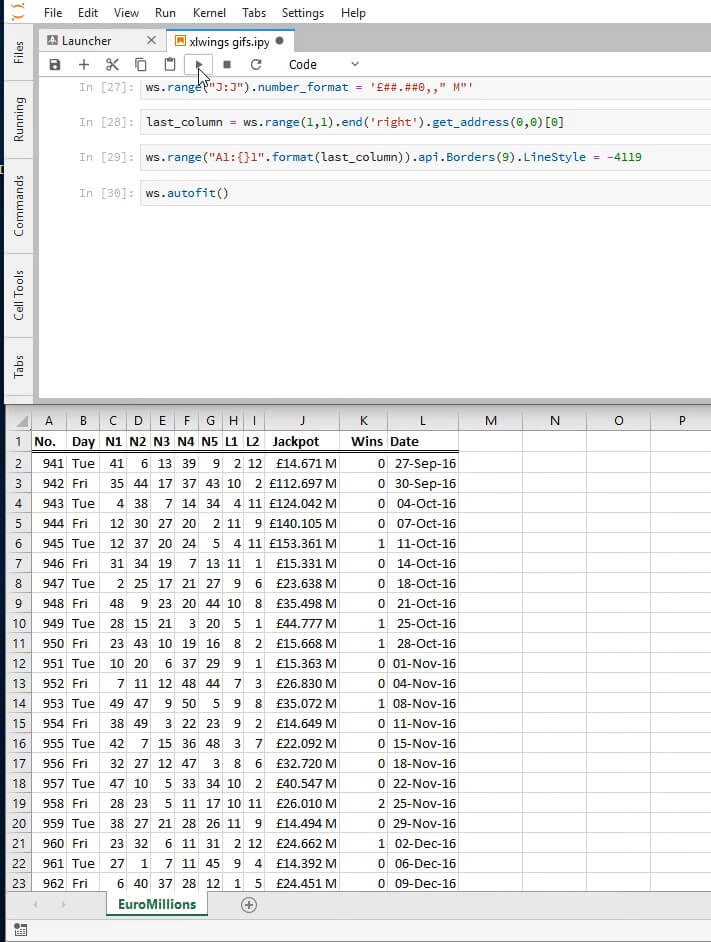
Oops! This looks a bit squished, let us set the width of all columns to that of column J which seems to be the largest. Here is the ColumnWidth documentation that we are using just below.
ws.range('A:L').api.ColumnWidth = ws.range('J:J').api.ColumnWidth
That should look better. And we're done with this sheet!
Let us add a new blank sheet called Frequencies and let us assign it to the Python name frequencies.
wb.sheets.add('Frequencies')
frequencies = wb.sheets['Frequencies']
We will be populating this sheet with the absolute frequencies of each number and each lucky star in the data set we just organized in the sheet EuroMillions.
# add a header for the numbers
frequencies.range('A1').value = 'Number'
# populate the fifty cells immediately below with the numbers 1 through 50
# since we're starting from the second row, we'll want to substract 1 from the row
frequencies.range('A2:A51').value = '=ROW()-1'
Below we'll be inserting a header for the frequencies in cell B1 and in cell B2 we will input a formula that will count how many times the value in A2 occurs in the range C2:G201. In other words, we will count how many times 1 occurred in the columns N1-N5. After this we will autofill the rest of the cells on column B to do the same for their respective rows.
# add a header for the frequencies
frequencies.range('B1').value = 'Frequency'
# insert on B2 the result of a standard Excel formula
frequencies.range('B2').value = '=COUNTIF(Euromillions!$C$2:$G$201,Frequencies!A2)'
autofill(frequencies, 'B2', 51)
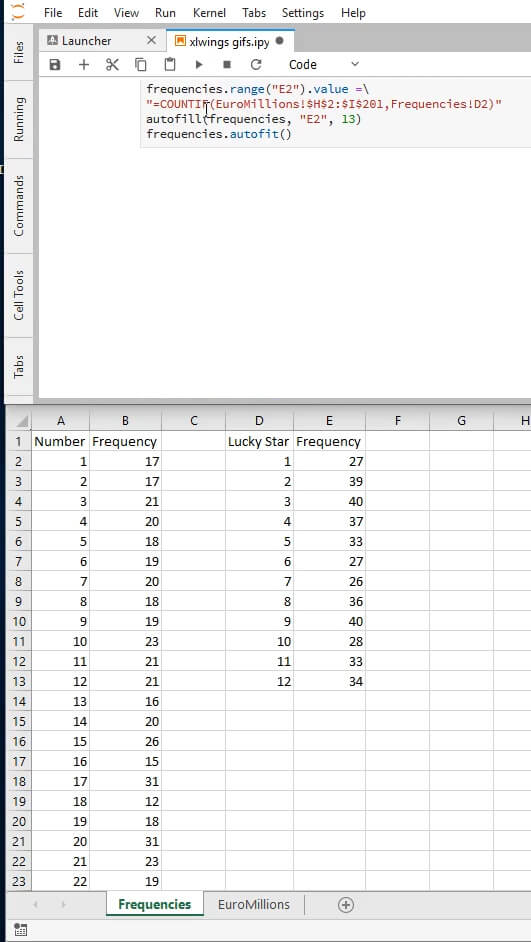
And we do the same for the lucky stars:
frequencies.range('D1').value = 'Lucky Star'
frequencies.range('E1').value = 'Frequency'
frequencies.range('D2:D13').value = '=ROW()-1'
frequencies.range('E2').value =\
'=COUNTIF(EuroMillions!$H$2:$I$201,Frequencies!D2)'
autofill(frequencies, 'E2', 13)
frequencies.autofit()
Here's how our new sheet should be looking at this point:
We are nearing our goal. Let's create a sheet called Graphs.
wb.sheets.add('Graphs')
graphs = wb.sheets['Graphs']
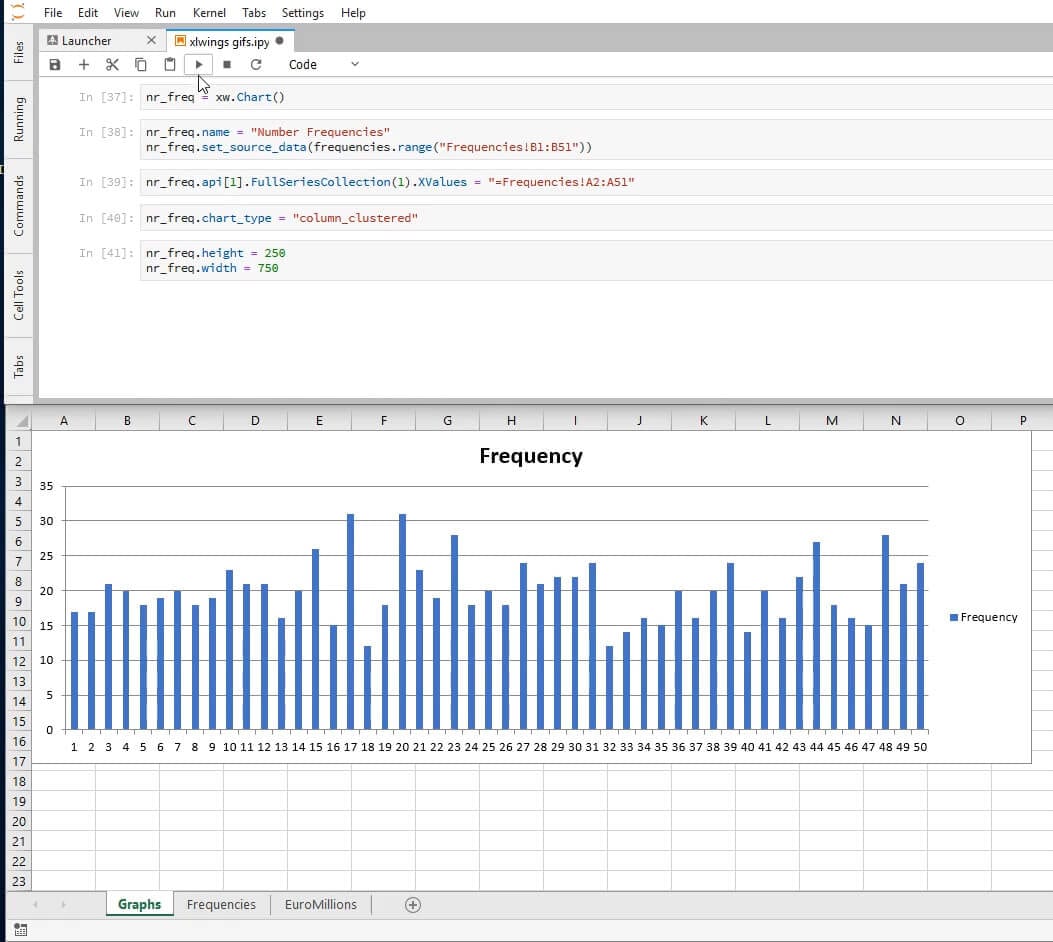
Now we'll create a Chart object. This will only produce a blank white box, but don't worry! We're going to use that box to chart our data in a moment.
nr_freq = xw.Chart()
We can name our chart similarly to what we did for sheets. The method set_source_data allows us to define the data source for our chart by passing in a range object.
nr_freq.name = 'Number Frequencies'
nr_freq.set_source_data(frequencies.range('Frequencies!B1:B51'))
Excel will try to guess what the x-axis should be, but we can force it to be the numbers we created on Frequencies by using the VBA Chart method FullSeriesCollection. We can edit the chart by using the object at index 1 of nr_freq.api:
nr_freq.api[1].FullSeriesCollection(1).XValues = '=Frequencies!A2:A51'
Excel is very good at guessing what kind of chart the user wants, but just in case it guesses incorrectly, we will force it to be a column chart. The various types of charts are listed here. Alas, the only documentation bridging these to the possible values of the chart_type attribute is the source code itself.
nr_freq.chart_type = 'column_clustered'
We will now define the height and the width of the chart. The measure unit will be points.
nr_freq.height = 250
nr_freq.width = 750
Here's what we should be seeing at this point:
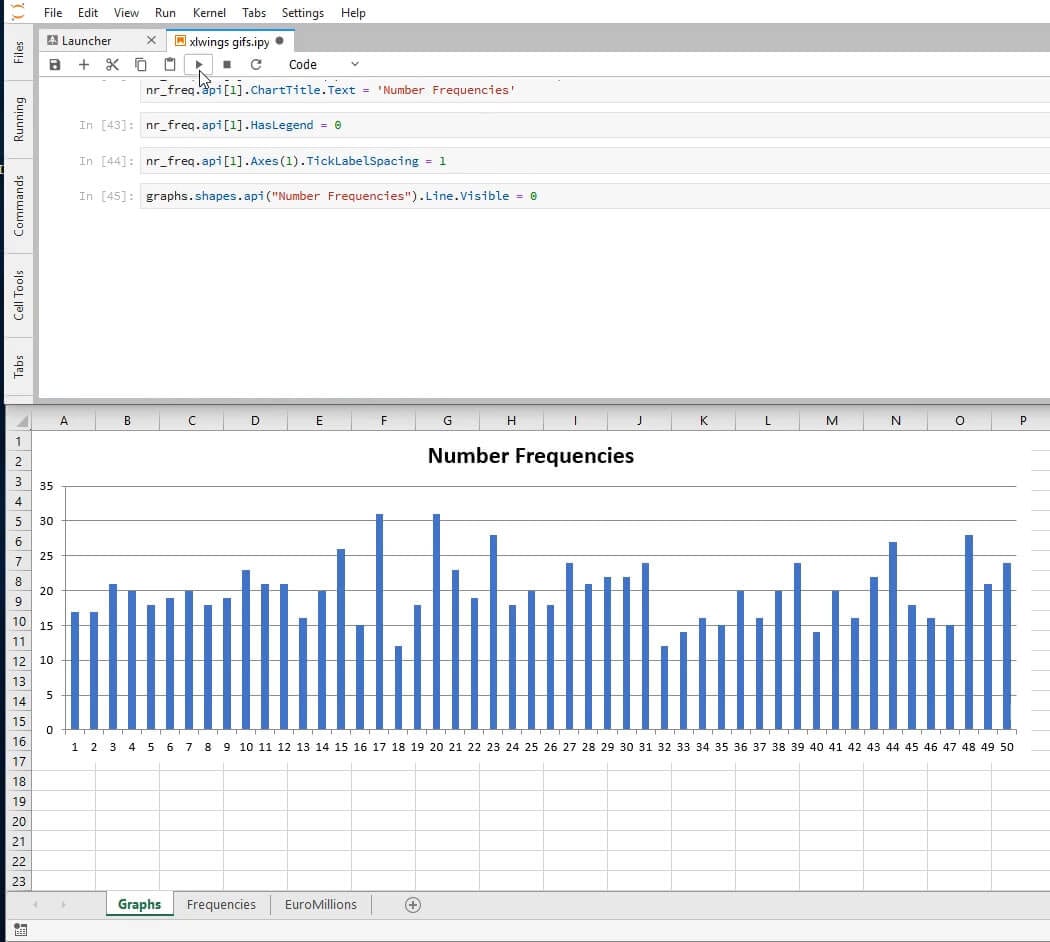
The SetElement method together with the parameter 2 sets the title above the chart. See other arguments here.
nr_freq.api[1].SetElement(2)  # Place chart title at the top
nr_freq.api[1].ChartTitle.Text = 'Number Frequencies'
And we add the final touches. We remove the legend using the HasLegend property.
nr_freq.api[1].HasLegend = 0
The xlCategory category passed in as the argument 1 to the Axes method, together with the property TickLabelSpacing set to 1, ensures that every element of our axis is displayed.
nr_freq.api[1].Axes(1).TickLabelSpacing = 1
To finish formatting this chart, we remove the outline by setting the property Visible of the Line object to 0.
graphs.shapes.api('Number Frequencies').Line.Visible = 0
And here's what we'll see:
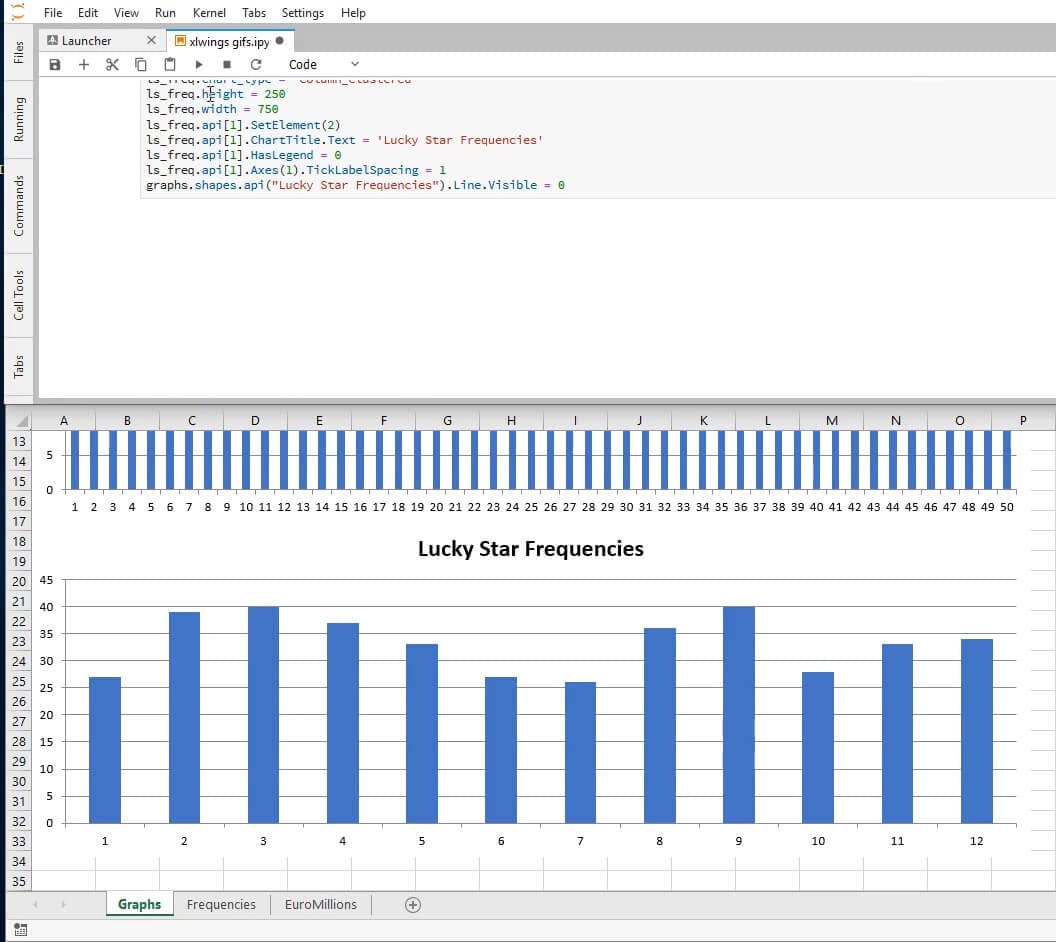
Below we do nearly the same thing for the lucky stars.
ls_freq = xw.Chart()
ls_freq.top = 250
ls_freq.name = 'Lucky Star Frequencies'
ls_freq.set_source_data(frequencies.range('Frequencies!E1:E13'))
ls_freq.api[1].FullSeriesCollection(1).XValues = '=Frequencies!D2:D13'
ls_freq.chart_type = 'column_clustered'
ls_freq.height = 250
ls_freq.width = 750
ls_freq.api[1].SetElement(2)
ls_freq.api[1].ChartTitle.Text = 'Lucky Star Frequencies'
ls_freq.api[1].HasLegend = 0
ls_freq.api[1].Axes(1).TickLabelSpacing = 1
graphs.shapes.api('Lucky Star Frequencies').Line.Visible = 0
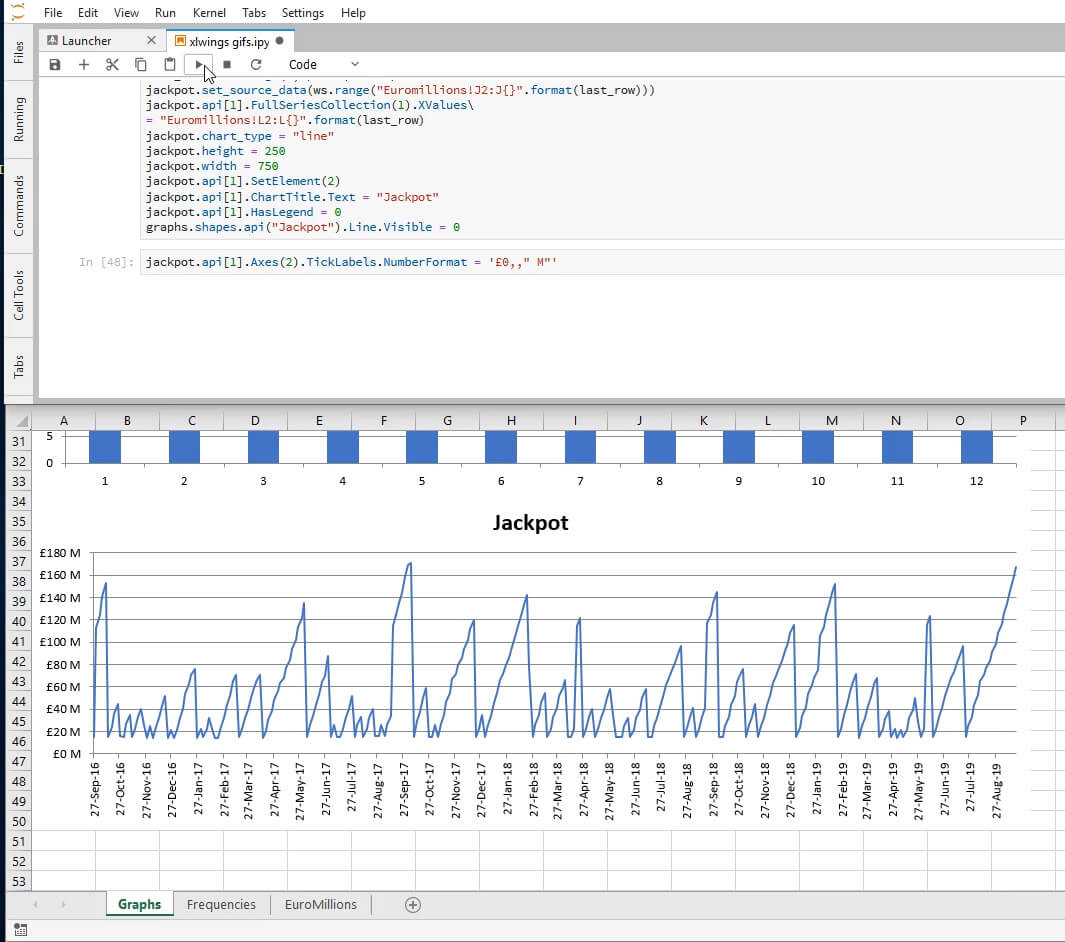
And to finalize we create a time series graph displaying the evolution of the jackpot.
jackpot = xw.Chart()
jackpot.top = 500
jackpot.name = 'Jackpot'
last_row = ws.range(1,1).end('down').row
jackpot.set_source_data(ws.range('Euromillions!J2:J{}'.format(last_row)))
jackpot.api[1].FullSeriesCollection(1).XValues\
= 'Euromillions!L2:L{}'.format(last_row)
jackpot.chart_type = 'line'
jackpot.height = 250
jackpot.width = 750
jackpot.api[1].SetElement(2)
jackpot.api[1].ChartTitle.Text = 'Jackpot'
jackpot.api[1].HasLegend = 0
graphs.shapes.api('Jackpot').Line.Visible = 0
And we fix the vertical axis' labels' format by setting the TickLabels property NumberFormat to the desired appearance.
jackpot.api[1].Axes(2).TickLabels.NumberFormat = "£0,,' M'"
And we're done! Now we save the file and exit our Excel instance.
wb.save('EuroMillions.xlsx')
xw.apps[0].quit()
Hopefully, this xlwings tutorial has been helpful!
Some useful resources for learning about xlwings are the official documentation, this formatting cheat sheet, the VBA for Excel documentation and the course xlwings: Python for Excel designed by Felix Zumstein himself, the developer of xlwings.