What Makes a Data Story?
When we think of storytelling, we usually picture a novel or a compelling movie script. But storytelling isn’t just for fiction — data professionals can (and should!) leverage the power of narrative to make insights resonate. That’s where data storytelling comes in.

What is a data story?
A data story is a narrative that combines numbers, visuals, and real-world context to spotlight meaningful insights and inspire action. A well-crafted data story goes beyond the numbers to answer the “so what?” behind your analysis. For example, it reveals why returning customers spend more than new customers, and how that finding can inform your marketing strategy.
- Numbers alone seldom inspire decisions: It’s easy to list metrics and hope they speak for themselves, but busy decision-makers often need more than a report. They need to understand how the data applies to their situation.
- A good story resonates: Stories stick. They help us see patterns, consequences, and opportunities, and ultimately move us to act.
Reporting vs. Storytelling
Before we continue, it’s important to distinguish between reporting and storytelling. While the terms are sometimes used interchangeably, they serve different purposes:
- Reporting: Focuses on listing facts, figures, or raw metrics. Reporting is useful for routine updates or compliance checks, but by itself, it rarely answers the “so what?”
- Storytelling: Builds on raw data to highlight relationships, patterns, and implications. It weaves insights into a clear narrative that explains why certain trends matter, and how they should inform decisions.
Key Difference
Reporting answers “What’s happening?” whereas storytelling pushes toward “Why is it happening, and what should we do next?”
With a clearer picture of how data storytelling goes beyond basic reporting to drive decisions, let’s look at the specific objectives we’ll cover in this tutorial. By the end, you’ll be able to:
- Explain how data storytelling improves data-driven decision-making
- Identify the three core components of a strong data story: Narrative, Visuals, and Context.
- Distinguish between simple reporting and effective storytelling
Case Study: The Superstore Challenge
To bring this concept to life throughout the tutorial, we’ll use a scenario of a fictional retailer called Superstore where you’ve recently joined the analytics team. The VP of marketing has made the following request:
“Our budget is tight this quarter, and we need to decide how to spend it wisely. Should we focus on attracting new customers or building deeper loyalty with returning customers?”
A simple enough question, right? But the answer must be backed by data. Superstore’s database has lots of data to analyze with fields such as:
- Transaction Value (how much each customer spent)
- Product Category (Automotive, Electronics, Toys, Sports, etc.)
- Market (regional or online)
- Discount Usage (whether a customer used a coupon or promo code)
- New vs. Returning Customer (indicator)
While we’re confident we can calculate averages and other key metrics, the VP ultimately wants more than just a list of numbers. They’re looking for clear, data-based recommendations. Next, let’s explore a storytelling framework that we can use to present our findings effectively to the VP of Marketing.
The Three Components of a Great Data Story
To turn raw observations into insights that spark smart business decisions, we need three core components: a compelling narrative, clear visuals, and the right context.
1. Narrative: Crafting a Logical Storyline

The narrative is our storyline—the framework that guides the audience through a series of insights. You can think of it in three main parts, much like most fictional stories with a beginning, middle, and end:
- Beginning (the “hook”): Identify a problem or question our audience cares about. By starting with a question, we focus our audience’s attention on a specific topic rather than giving a wide-angle view of every possible data point.
- Middle (investigation): Show how we analyzed the data. Depending on our audience’s needs, this could be a detailed step-by-step walkthrough or a quick summary of our methodology. We’ll talk more about tailoring to your audience later, but remember that the “investigation” step will vary by stakeholder.
- Ending (recommendation): Present our conclusion and connect it back to the original problem. This is often the most important part of the narrative, because it’s where we show how the data can directly inform decisions.
These steps may sound straightforward because the structure feels familiar, but translating this story arc into data-driven recommendations is a challenge many organizations struggle with.
Here’s what it might look like in our Superstore scenario:
- Hook: “Superstore’s marketing budget is tight. Should we go after new customers or focus on loyal, returning ones?”
- Data Investigation: Here is where we dig deeper—perhaps comparing transaction amounts by category and market to uncover spending patterns.
- Conclusion & Action: Finally, connect the dots and suggest practical next steps. In this case, we’d advise on whether to target new or returning customers, based on the data.
We’ll see these steps in higher detail in the Superstore case study at the end of this tutorial.
2. Visuals: Supporting the Story

While the narrative is the heart of a data story, visuals often drive your points home. Why? Because tables and raw data can be overwhelming, especially for non-technical audiences. Charts and graphs let people immediately see patterns and trends, so they spend less time parsing numbers and more time focusing on your insights.
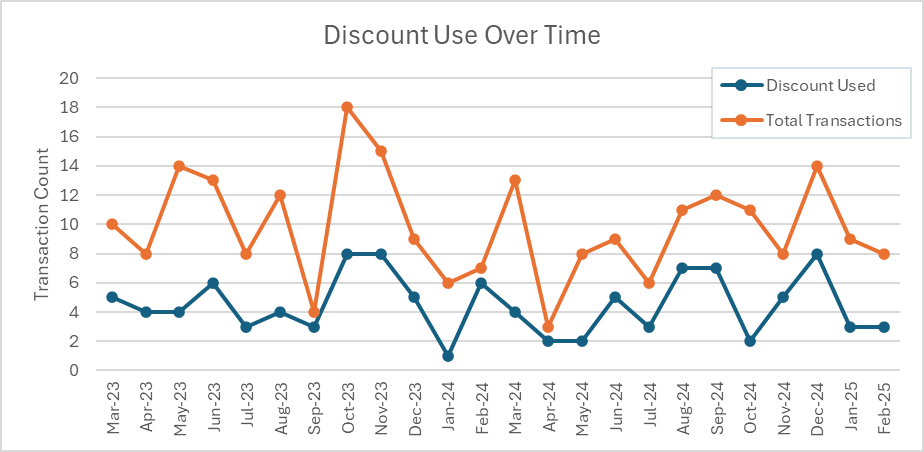
To give you a quick sense of how visuals can help, imagine we have monthly data for Superstore’s discount usage. Instead of listing every discount and resulting sale in a table, we can use two different charts to highlight different aspects of the same data: one to compare discount usage against total transactions, and another to show their proportions each month.
-
A Two‐Line Chart (Discount Used vs. Total Transactions)

- This clearly compares discount usage to overall transaction volume, making it easy to see if an increase in discounts might be driving more total sales, or if more discounts aren’t actually boosting business.
-
A Stacked Bar Chart (No Discount Used vs. Discount Used)

- This instantly shows both total transactions and what proportion used discounts in any given month. It makes it simple to gauge the overall scale (height of each stack) and the proportion of discounted sales (the orange segment).

Notice how each chart has a different strength:
- The line chart focuses on trends and relationships—where you can quickly spot if a spike in discounts coincides with a spike in total transactions.
- The stacked bar chart is more intuitive for seeing the raw count of transactions each month and roughly what percentage of them used a discount.
While we’ll go deeper into effective visual design in future lessons, here are a few key ideas to keep in mind:
- Keep your visuals straightforward. Too many lines or data series can be distracting.
- Align chart types with your message. Use line charts for spotting trends and correlations, and consider bar charts when you want to show proportions or total counts.
- Use consistent colors and clear labels so viewers can easily interpret the data.
By choosing the right chart for the right question, you’ll ensure your audience sees the bigger picture of how discounts affect overall sales, and you won’t bury them in numbers or overcomplicated visuals. When done right, your visuals will reinforce your narrative by showing exactly where and how the data supports your story.
3. Context: Tailoring Data to Your Audience

Even the best narrative and clearest visuals can fall flat if they’re not aligned with what your stakeholders care about. Context means tailoring your data story so it resonates with each audience’s priorities.
Different stakeholders place value on different metrics and details, so knowing your audience is important. For example:
- Marketing Managers might want to see how discounts affect customer acquisition costs and conversion rates.
- Finance Directors focus on how changes in revenue and expenses affect margins and profitability.
- Executives often prefer a concise, high-level summary that ties directly to strategic goals or ROI.
- Analytics Teams need enough detail on methodologies, data cleaning, and assumptions to replicate or validate your results.
When it comes to Superstore, we should consider presenting the VP of Marketing with a single bar chart comparing new versus returning customers’ average spend, coupled with a straightforward recommendation. Conversely, the analytics team may require a deeper look at our data sources, how you cleaned the data, and any modeling techniques used.
Ultimately, providing the right level of detail and relevant examples helps each stakeholder see how the data informs their decisions. The moment your audience recognizes how the insights tie back to their goals, your data story has done its job.
Case Study: Superstore Customer Retention
Remember the scenario where the VP of marketing asked, “Should we focus on attracting new customers or building deeper loyalty with returning customers?”
Let’s compare two strategies, straightforward reporting vs. storytelling with context, to see the difference a data story makes when presenting the same insights to stakeholders.
Strategy 1: Straightforward Reporting
Report Summary:
- Average transaction value for returning customers: \$534
- Average transaction value for new customers: \$508
- Overall difference is ~5%.
Table:
Product Category Returner Avg (\$) New Avg (\$) Difference (\$) Automotive 555 419 +136 Electronics 513 415 +98 Toys 521 573 -52 Sports 490 562 -72
The Takeaway for Strategy 1
While the table presents interesting differences, it leaves the audience to interpret why these differences matter or how to act on them.
Strategy 2: Storytelling with Context and Action
Following the three components of a great data story, let’s begin with a narrative that sets the stage:
The Hook:
“Superstore needs to decide whether to spend limited marketing dollars on acquiring new customers or retaining existing ones. While the overall average spend looks similar (\$508 vs. \$534), a deeper analysis by product category reveals a surprising disparity.”
The Data Investigation:
“When we broke down customer spending by product type, a pattern emerged: some categories perform better with new customers, while others see higher spend from returning customers. Take a look at the average spend by product type:”
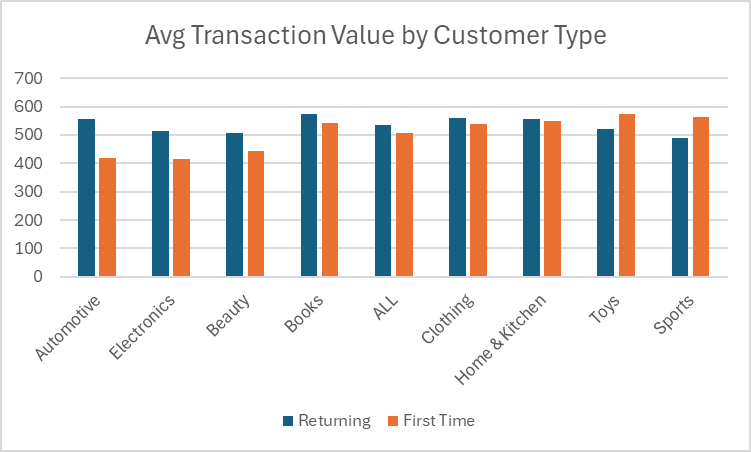
Key Insights (Context):
- Automotive: Returning customers spend about \$136 more per transaction than new ones, ideal for loyalty promotions.
- Electronics: Returning customers outspend new customers by around \$98, again pointing to retention-focused campaigns.
- Toys & Sports: New customers spend more (\$52–\$72), suggesting these categories could benefit from targeted acquisition campaigns.
During this investigation phase, both the visuals and commentary highlight where the differences lie and why they matter.
The Conclusion and Recommendation:
“Based on these insights, we propose a two-pronged strategy:
- Upsell Returning Customers in Automotive and Electronics through loyalty rewards, personalized emails, and targeted promotions.
- Attract New Customers in Toys and Sports using social media ads, influencer partnerships, and introductory discount codes.
By matching the approach to each category’s unique behavior, Superstore can focus spending where it’s most effective. Retention campaigns will likely boost profits in Automotive and Electronics, while acquisition campaigns can tap into new-customer enthusiasm for Toys and Sports.”
The Takeaway for Strategy 2
Notice how we used the same numbers as Strategy 1 but framed them in a way that’s instantly actionable. The Marketing VP sees a direct path from the data to a recommended decision, and that’s the power of storytelling.
Putting It All Together
Data storytelling is about more than pretty visuals or catchy headlines. It’s a structured approach to analytics that ensures your insights drive real-world decisions. Here’s how you can apply it in your own work:
-
Start with a Question or Problem
For Superstore, the question was whether to invest in new customers or focus on retaining existing ones. Having a clear problem frames all subsequent analysis.
-
Dig into the Data
Perform the necessary analyses—averages, breakdowns, trends. Look for hidden variations or patterns.
-
Develop a Narrative
Lead your audience from problem to recommendation in a logical flow. Each step should answer why your findings matter. -
Use Visuals Strategically
Select chart types that best highlight your key findings and avoid visual clutter.
-
Provide Context
Translate insights into language and metrics that resonate with your stakeholders, whether they’re executives, marketers, or finance directors.
A Final Word
Remember: A good story reveals the “why,” not just the “what.” In the Superstore scenario, it’s not enough to say, “Automotive returners spend \$555.” You need to explain why that matters and how your audience can use that insight to shape their marketing strategy. When you combine data, narrative, and audience-focused context, you’ll guide your team toward better, more impactful decisions.