How to Implement Support Vector Machines in Python
In this tutorial, we'll cover the support vector machine, one of the most popular classification algorithms. First, we'll discuss the intuition of the algorithm, and then we'll see how to implement it for a classification task in Python. This tutorial assumes some familiarity with Python syntax and data cleaning.
The Intuition
To understand how a support vector machine (or SVM, for short) performs classification, we'll explore a brief metaphor. Let's say that Anna and Bob are two siblings that share a room. One day, Anna and Bob get into an argument and don't want to be near each other afterward. Their mother sends them to their room to work things out, but they do something else.
Anna lays down a line down the middle of the room. "Everything on this side is mine, and everything on the other side is yours," says Anna.
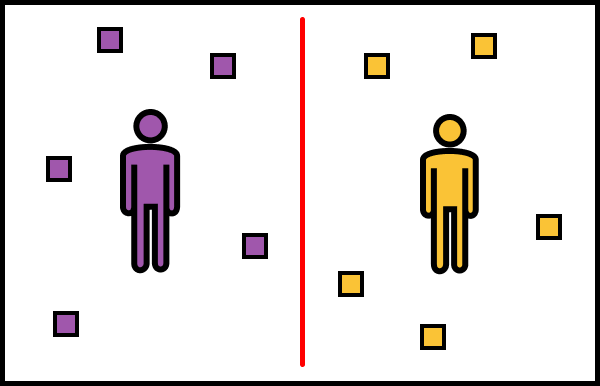
Another way of thinking about this line is that it classifies everything as either "Anna's" or "not Anna's" (or "Bob's" and "not Bob's"). Anna's line can be viewed as a classification algorithm, and SVMs work in a similar way! At their heart, given a set of points from two different classes (i.e., Anna's and "not Anna's"), an SVM tries to create a line that separates the two. There may be some errors, like if one of Bob's items is on Anna's side, but the line created by SVM does its best to separate the two.
The Problem
Now that we understand the algorithm, let's see it in action. We'll look at the Heart Disease Dataset from the UCI Machine Learning Repository. This dataset contains information on various patients with heart disease. We would like to predict whether or not a person has heart disease based on two things: their age and cholesterol level. It's well known that age and higher cholesterol is associated with higher rates of heart disease, so perhaps we can use this information to try to predict heart disease in others.
When we look at the data, however, the distribution of heart disease is varied:
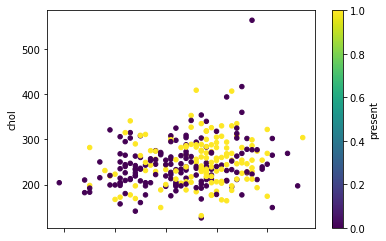
Unlike Anna and Bob's room, there is no clear separating line between people who have heart disease (present = 1) and those who don't (present = 0). This is common in real-world machine learning tasks, so we shouldn't let this difficulty stop us. SVMs work particularly well in these situations because they try to find ways to better "separate" the two classes.
The Solution
First, we'll load in the data and then separate it into training and test sets. The training set will help us find a "line" to separate the people with and without heart disease, and the test set will tell us how well the model works on people it hasn't seen before. We'll use 80% of the data for training and the rest for the test set.
import pandas as pd
import math

heart = pd.read_csv("heart_disease")

nrows = math.floor(heart.shape[0] * 0.8)

training = heart.loc[:nrows]
test = heart.loc[nrows:]
With the data loaded, we can prepare the model to be fit to the data. SVMs are in the svm module of scikit-learn in the SVC class. "SVC" stands for "Support Vector Classifier" and is a close relative to the SVM. We can use SVC to implement SVMs.
from sklearn.svm import SVC

model = SVC()
model.fit(training[["age", "chol"]], training["present"])
After bringing in the SVC class, we fit the model using the age and chol columns from the training set. Using the fit method builds the "line" that separates those with heart disease from those without.
Once the model has been fit, we can use it to predict the heart disease status in the test group. We can compare the model predictions to the actual observations in the test data.
predictions = model.predict(test[["age", "chol"]])

accuracy = sum(test["present"] == predictions) / test.shape[0]
To summarize how well the SVM predicts heart disease in the test set, we'll calculate the accuracy. Accuracy is the proportion of the observations that are predicted correctly. Let's see how the model performed . . .
accuracy0.4666666666666667The model has an accuracy of about 46.7% on the test data set. This isn't great — we would get better results from just flipping a coin! This indicates that our original intuition may have been incorrect. There are several factors that can increase the risk of heart disease, so we might benefit from using more information.
It's common for initial models to perform poorly, so we shouldn't let this discourage us.
Improving Our Model
In our next iteration, we'll try to incorporate more features into the model so that it has more information to try to separate those with heart disease and those without. Now, we'll incorporate the thalach column, in addition to age and chol. The thalach column represents the maximum heart rate achieved by the individual. This column captures how much work the person's heart is capable of.
We'll repeat the same model fitting process as above, but we'll include the thalach column.
model = SVC()
model.fit(training[["age", "chol", "thalach"]],
          training["present"])

predictions = model.predict(test[["age", "chol", "thalach"]])

accuracy = sum(test["present"] == predictions) / test.shape[0]
After this is done, we can check the accuracy of this new model to see if it performs better.
accuracy0.6833333333We now have an accuracy of 68.3%! We would still want this accuracy to be higher, but it at least shows that we're on the right track. Based on what we saw here, the SVM model was able to use the thalach column to better separate the two classes.
Next Steps
We don't have to stop here! We can continue to iterate and improve upon the model by adding new features or removing those that don't help. We encourage you to explore more and increase the test accuracy as much as you can.
In this tutorial, we introduced the Support Vector Machine (SVM) and how it performs classification. We applied the SVM to disease prediction, and we saw how we might improve the model with more features.
If you liked this tutorial and want to learn more about machine learning, Dataquest has a full course covering the topic in our Data Scientist in Python Career Path.