Tutorial: Advanced Python for Loops
In a previous tutorial, we covered the basics of Python for loops, looking at how to iterate over lists and over lists of lists. But there's a lot more to for loops than looping through lists! In real-world data science work, you may want to use advanced Python for loops with other data structures, including NumPy arrays and pandas DataFrames.
This tutorial begins with how to use for loops to iterate through common Python data structures other than lists (like tuples and dictionaries). Then we'll dig into using for loops in tandem with common Python data science libraries like numpy, pandas, and matplotlib. We'll also take a closer look at the range() function and how it's useful when writing for loops.
Before we get started, you might want to take a look at Dataquest's Complete Python Guide for Beginners.
A Quick Review: The Python for Loop
A for loop is a programming statement that tells Python to iterate over a collection of objects, performing the same operation on each object in sequence. The basic syntax is:
for object in collection_of_objects:
    # code you want to execute on each object
Each time Python iterates through the loop, the variable object takes on the value of the next object in our sequence collection_of_objects, and Python will execute the code we have written on each object from collection_of_objects in sequence.
Now, let's dive into how to use for loops with different sorts of data structures. We'll skip lists since those have been covered in the previous tutorial; if you need further review, check out the introductory Python for loops tutorial or Dataquest's interactive lesson on lists and for loops.
Data Structures
Tuples
Tuples are sequences, just like lists. The difference between tuples and lists is that tuples are immutable; that is, they cannot be changed (learn more about mutable and immutable objects in Python). Tuples also use parentheses instead of square brackets.
Regardless of these differences, looping over tuples is very similar to lists.
x = (<span class="hljs-number">10</span>, <span class="hljs-number">20</span>, <span class="hljs-number">30</span>, <span class="hljs-number">40</span>, <span class="hljs-number">50</span>)
<span class="hljs-keyword">for</span> var <span class="hljs-keyword">in</span> x:
    print(<span class="hljs-string">"index "</span>+ str(x.index(var)) + <span class="hljs-string">":"</span>, var)
index 0: 10
index 1: 20
index 2: 30
index 3: 40
index 4: 50If we have a list of tuples, we can access the individual elements in each tuple in our list by including them both as variables in the for loop, like so:
x = [(<span class="hljs-number">1</span>,<span class="hljs-number">2</span>), (<span class="hljs-number">3</span>,<span class="hljs-number">4</span>), (<span class="hljs-number">5</span>,<span class="hljs-number">6</span>)]

<span class="hljs-keyword">for</span> a, b <span class="hljs-keyword">in</span> x:
    print(a, <span class="hljs-string">"plus"</span>, b, <span class="hljs-string">"equals"</span>, a+b)
1 plus 2 equals 3
3 plus 4 equals 7
5 plus 6 equals 11Dictionaries
In addition to lists and tuples, dictionaries are another common Python data type you're likely to encounter when working with data, and for loops can iterate through dictionaries, too.
Python dictionaries are composed of key-value pairs, so in each loop, there are two elements we need to access (the key and the value). Instead of using enumerate() like we would with lists, to loop over both keys and the corresponding values for each key-value pair we need to call the .items() method.
For example, imagine we have a dictionary called stocks that contains both stock tickers and the corresponding stock prices. We'll use the .items() method on our dictionary to generate a key and value for each iteration:
stocks = {
        <span class="hljs-string">'AAPL'</span>: <span class="hljs-number">187.31</span>,
        <span class="hljs-string">'MSFT'</span>: <span class="hljs-number">124.06</span>,
        <span class="hljs-string">'FB'</span>: <span class="hljs-number">183.50</span>
    }

<span class="hljs-keyword">for</span> key, value <span class="hljs-keyword">in</span> stocks.items() :
    print(key + <span class="hljs-string">" : "</span> + str(value))
AAPL : 187.31
MSFT : 124.06
FB : 183.5Note that the variable names we chose (key and value) are completely arbitrary―well not completely arbitrary since we chose descriptive names for them, which is always a good idea when deciding on variable names! That all said, we could have initialized these variables as k and v or x and y if we wanted to.
Strings
As mentioned in the introductory tutorial, for loops can also iterate through each character in a string. As a quick review, here's how that works:
print(<span class="hljs-string">"data science"</span>)
<span class="hljs-keyword">for</span> c <span class="hljs-keyword">in</span> <span class="hljs-string">"data science"</span>:
    print(c)
data science
d
a
t
a
s
c
i
e
n
c
eNumPy Arrays
Now, let's take a look at how for loops can be used with common Python data science packages and their data types.
We'll start by looking at how to use for loops with numpy arrays, so let's start by creating some arrays of random numbers.
<span class="hljs-keyword">import</span> numpy <span class="hljs-keyword">as</span> np

np.random.seed(<span class="hljs-number">0</span>)  <span class="hljs-comment"># seed for reproducibility</span>
x = np.random.randint(<span class="hljs-number">10</span>, size=<span class="hljs-number">6</span>)
y = np.random.randint(<span class="hljs-number">10</span>, size=<span class="hljs-number">6</span>)
Iterating over a one-dimensional NumPy array is very similar to iterating over a list:
<span class="hljs-keyword">for</span> val <span class="hljs-keyword">in</span> x:
    print(val)
5
0
3
3
7
9Now, what if we want to iterate through a two-dimensional array? If we use the same syntax to iterate a two-dimensional array as we did above, we can only iterate entire arrays on each iteration.
<span class="hljs-comment"># creating our 2-dimensional array</span>
z = np.array([x, y])

<span class="hljs-keyword">for</span> val <span class="hljs-keyword">in</span> z:
    print(val)
[5 0 3 3 7 9]
[3 5 2 4 7 6]A two-dimensional array is built up from a pair of one-dimensional arrays. To visit every element rather than every array, we can use the NumPy function nditer(), a multi-dimensional iterator object which takes an array as its argument.
In the code below, we'll write a for loop that iterates through each element by passing z, our two-dimensional array, as the argument for nditer():
<span class="hljs-keyword">for</span> val <span class="hljs-keyword">in</span> np.nditer(z):
    print(val)
5
0
3
3
7
9
3
5
2
4
7
6As we can see, this first lists all of the elements in x, then all elements of y.
Remember! When looping through these different data structures, dictionaries require a method, NumPy arrays require a function.
Pandas DataFrames
When we're working with data in Python, we're often using pandas DataFrames. And thankfully, we can use for loops to iterate through those, too.
Let's practice doing this while working with a small CSV file that records the GDP, capital city, and population for six different countries. We will read this into a pandas DataFrame below.
Pandas works a bit differently from NumPy, so we won't be able to simply repeat the NumPy process we've already learned. If we try to iterate over a pandas DataFrame as we would a NumPy array, this would just print out the column names:
<span class="hljs-keyword">import</span> pandas <span class="hljs-keyword">as</span> pd
df = pd.read_csv(<span class="hljs-string">'gdp.csv'</span>, index_col=<span class="hljs-number">0</span>)

<span class="hljs-keyword">for</span> val <span class="hljs-keyword">in</span> df:
    print(val)
Capital
GDP ($US Trillion)
PopulationInstead, we need to mention explicitly that we want to iterate over the rows of the DataFrame. We do this by calling the iterrows() method on the DataFrame, and print row labels and row data, where a row is the entire pandas series.
<span class="hljs-keyword">for</span> label, row <span class="hljs-keyword">in</span> df.iterrows():
    print(label)
    print(row)
Ireland
Capital Dublin
GDP ($US Trillion) 0.3337
Population 4784000
Name: Ireland, dtype: object
United Kingdom
Capital London
GDP ($US Trillion) 2.622
Population 66040000
Name: United Kingdom, dtype: object
United States
Capital Washington, D.C.
GDP ($US Trillion) 19.39
Population 327200000
Name: United States, dtype: object
China
Capital Beijing
GDP ($US Trillion) 12.24
Population 1386000000
Name: China, dtype: object
India
Capital New Delhi
GDP ($US Trillion) 2.597
Population 1339000000
Name: India, dtype: object
Germany
Capital Berlin
GDP ($US Trillion) 3.677
Population 82790000
Name: Germany, dtype: objectWe can also access specific values from a pandas series. Suppose we just want to print out the capital of each country. We can specify that we want only output from the "Capital" column like so:
<span class="hljs-keyword">for</span> label, row <span class="hljs-keyword">in</span> df.iterrows():
    print(label + <span class="hljs-string">" : "</span> + row[<span class="hljs-string">"Capital"</span>])
Ireland : Dublin
United Kingdom : London
United States : Washington, D.C.
China : Beijing
India : New Delhi
Germany : BerlinTo take things further than simple printouts, let's add a column using a for loop. Let's add a GDP per capita column. Remember that .loc[] is label-based. In the code below, we'll add the column and compute its contents for each country by dividing its total GDP from its population and multiplying the result by one trillion (since the GDP numbers are listed in trillions).
<span class="hljs-keyword">for</span> label, row <span class="hljs-keyword">in</span> df.iterrows():
    df.loc[label,<span class="hljs-string">'gdp_per_cap'</span>] = row[<span class="hljs-string">'GDP ($US Trillion)'</span>]/row[<span class="hljs-string">'Population '</span>] * <span class="hljs-number">1000000000000</span>
print(df)
Capital GDP ($US Trillion) Population \
Country
Ireland Dublin 0.3337 4784000
United Kingdom London 2.6220 66040000
United States Washington, D.C. 19.3900 327200000
China Beijing 12.2400 1386000000
India New Delhi 2.5970 1339000000
Germany Berlin 3.6770 82790000
gdp_per_cap
Country
Ireland 69753.344482
United Kingdom 39703.210176
United States 59260.391198
China 8831.168831
India 1939.507095
Germany 44413.576519For each row in our dataframe, we are creating a new label, and setting the row data equal to the total GDP divided by the country’s population, and multiplying by $1T for thousands of dollars.
The range() function
We have seen how we can use for loops to iterate over any sequence or data structure. But what if we would like to iterate over these sequences in a specific order, or for a specific number of times?
This can be accomplished with Python’s built-in range() function. Depending on how many arguments you pass to the function, you can decide where that series of numbers will begin and end as well as how big the difference will be between one number and the next. Note that, similar to lists, the range() function’s count starts from 0 and not from 1.
There are three ways we can call range():
range(stop)range(start, stop)range(start, stop, step)
range(stop)
When we want to iterate over a series of consecutive integers that starts at 0 and includes every number up to, but not including, the stop value, we use range(stop).
<span class="hljs-keyword">for</span> i <span class="hljs-keyword">in</span> range(<span class="hljs-number">3</span>):
    print(i)
0
1
2range(start, stop)
Here, we also want to set the end of the series (stop) but also the beginning (start) as well. We can use the range() function to generate an integer series from A to B (not including B) using range(A, B).
<span class="hljs-keyword">for</span> i <span class="hljs-keyword">in</span> range(<span class="hljs-number">1</span>, <span class="hljs-number">8</span>):
    print(i)
1
2
3
4
5
6
7range(start, stop, step)
In addition to being able to set the start and stop values, we can also set the difference between one number in the sequence and the next be passing a step value when calling range(start, stop, step). The default step value is 1 if none is provided.
<span class="hljs-keyword">for</span> i <span class="hljs-keyword">in</span> range(<span class="hljs-number">3</span>, <span class="hljs-number">16</span>, <span class="hljs-number">3</span>):
    print(i)
3
6
9
12
15Note that step works the same for non-numerical sequences too.
We can also use the index of elements in a sequence to iterate. The key idea is to first calculate the length of the list and then iterate over the sequence within the range of this length. Let's take a look at an example:
languages = [<span class="hljs-string">'Spanish'</span>, <span class="hljs-string">'English'</span>,  <span class="hljs-string">'French'</span>, <span class="hljs-string">'German'</span>, <span class="hljs-string">'Irish'</span>, <span class="hljs-string">'Chinese'</span>]

<span class="hljs-keyword">for</span> idx <span class="hljs-keyword">in</span> range(len(languages)):
   print(<span class="hljs-string">'Language:'</span>, languages[idx])
Language: Spanish
Language: English
Language: French
Language: German
Language: Irish
Language: ChineseIn our for loop above, we are using the variable’s index (idx) and language, the in keyword, and the range() function to create a sequence of numbers. Note that we also use the len() function in this case, as the list is not numerical.
For each iteration, we are executing our print statement. So for every index in the range len(languages), we want to print its associated language. Because the length of our languages sequence is 6 (that is the value that len(langauges) evaluates to), we can rewrite the statement as follows:
<span class="hljs-keyword">for</span> idx <span class="hljs-keyword">in</span> range(<span class="hljs-number">6</span>):
    print(<span class="hljs-string">'Language:'</span>, languages[idx])
Language: Spanish
Language: English
Language: French
Language: German
Language: Irish
Language: ChinesePlotting with for Loops
Suppose we want to iterate through a collection, and use each element to produce a subplot, or even for each trace in a single plot. For example, let’s take the popular iris data set (learn more about this data) and do some plotting with for loops. Consider the graph below.
<span class="hljs-keyword">import</span> pandas <span class="hljs-keyword">as</span> pd
<span class="hljs-keyword">import</span> matplotlib.pyplot <span class="hljs-keyword">as</span> plt
\%config InlineBackend.figure_format = <span class="hljs-string">'retina'</span>  # used to set figure format when working in an interactive notebook

df = pd.read_csv(<span class="hljs-string">'iris.csv'</span>)<span class="hljs-comment"># create a figure and axis</span>
fig, ax = plt.subplots()
<span class="hljs-comment"># scatter the sepal_length against the sepal_width</span>
ax.scatter(df[<span class="hljs-string">'sepal_length'</span>], df[<span class="hljs-string">'sepal_width'</span>])
<span class="hljs-comment"># set a title and labels</span>
ax.set_title(<span class="hljs-string">'Iris Dataset'</span>)
ax.set_xlabel(<span class="hljs-string">'sepal_length'</span>)
ax.set_ylabel(<span class="hljs-string">'sepal_width'</span>)Text(0,0.5,'sepal_width')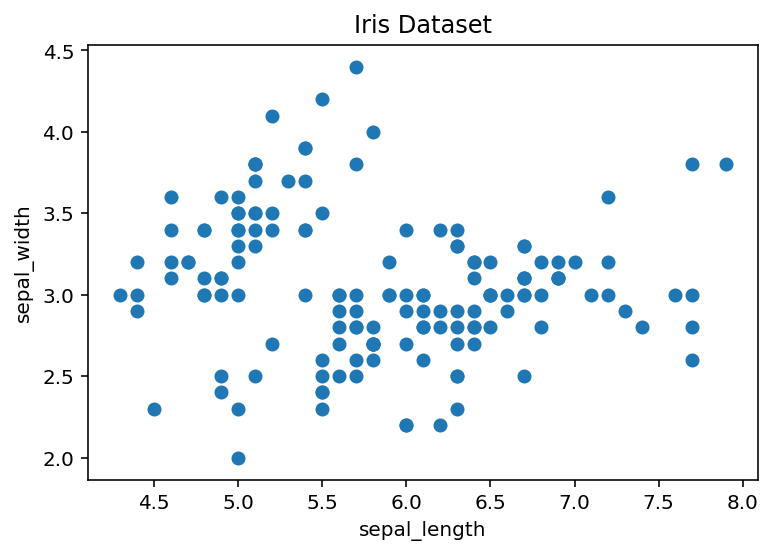
Above, we’ve plotted each sepal length vs sepal width, but we can give the graph more meaning by coloring in each data point by each flower's species class. One way to do this is by scattering each point on its own using a for loop and passing in the respective color.
<span class="hljs-comment"># create color dictionary</span>
colors = {<span class="hljs-string">'setosa'</span>:<span class="hljs-string">'r'</span>, <span class="hljs-string">'versicolor'</span>:<span class="hljs-string">'g'</span>, <span class="hljs-string">'virginica'</span>:<span class="hljs-string">'b'</span>}

<span class="hljs-comment"># create a figure and axis</span>
fig, ax = plt.subplots()

<span class="hljs-comment"># plot each data-point</span>
<span class="hljs-keyword">for</span> i <span class="hljs-keyword">in</span> range(len(df[<span class="hljs-string">'sepal_length'</span>])):
    ax.scatter(df[<span class="hljs-string">'sepal_length'</span>][i], df[<span class="hljs-string">'sepal_width'</span>][i], color=colors[df[<span class="hljs-string">'species'</span>][i]])

<span class="hljs-comment"># set a title and labels</span>
ax.set_title(<span class="hljs-string">'Iris Dataset'</span>)
ax.set_xlabel(<span class="hljs-string">'sepal_length'</span>)
ax.set_ylabel(<span class="hljs-string">'sepal_width'</span>)
Text(0,0.5,'sepal_width')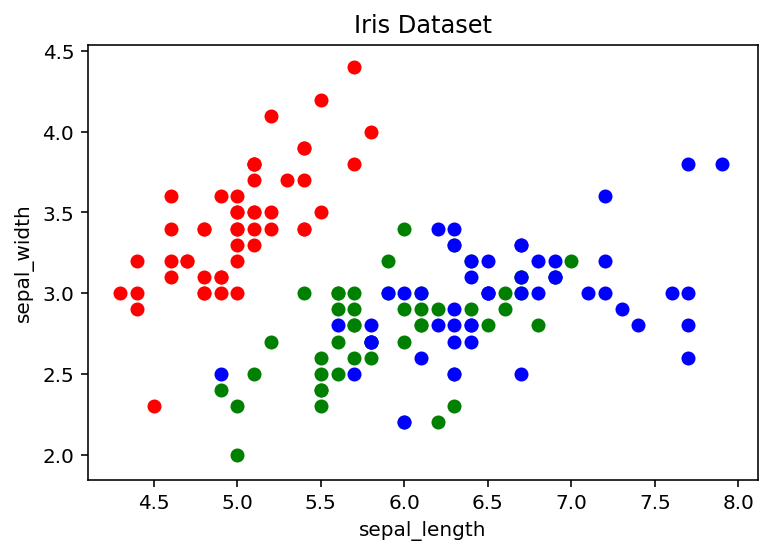
What if we want to visualize the univariate distribution of certain features of our iris dataset? We can do this with plt.subplot(), which creates a single subplot within a grid, the numbers of columns and rows of which we can set.
fig, axes = plt.subplots(nrows=<span class="hljs-number">2</span>, ncols=<span class="hljs-number">2</span>, figsize=(<span class="hljs-number">8</span>, <span class="hljs-number">6</span>))
fig.subplots_adjust(hspace=<span class="hljs-number">0.8</span>)
fig.suptitle(<span class="hljs-string">'Distributions of Iris Features'</span>)

<span class="hljs-keyword">for</span> ax, feature, name <span class="hljs-keyword">in</span> zip(axes.flatten(), df.drop(<span class="hljs-string">'species'</span>,axis=<span class="hljs-number">1</span>).values.T, df.columns.values):
    ax.hist(feature, bins=len(np.unique(df.drop(<span class="hljs-string">'species'</span>,axis=<span class="hljs-number">1</span>).values.T[<span class="hljs-number">0</span>])//<span class="hljs-number">2</span>))
    ax.set(title=name[:-<span class="hljs-number">4</span>].upper(), xlabel=<span class="hljs-string">'cm'</span>)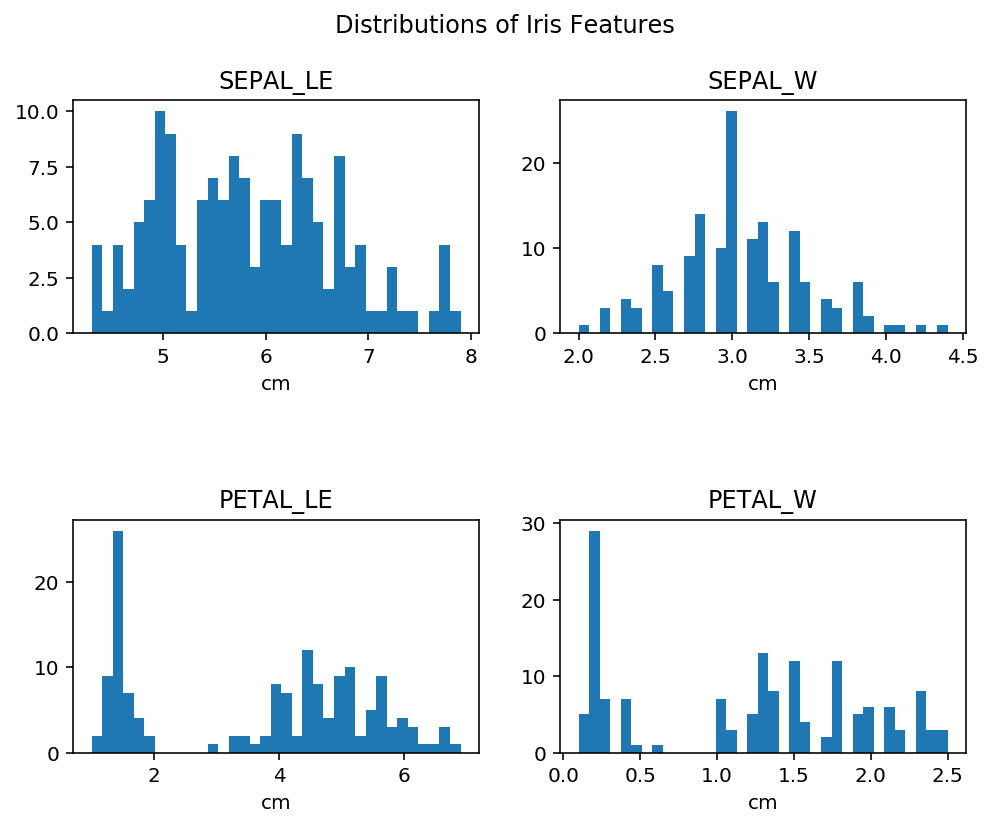
Without diving too deep into the matplotlib syntax for now, below is a brief description of each main component of our graph:
plt.subplot( )- used to create our 2-by-2 grid and set the overall size.zip( )- this is a built-in python function that makes it super simple to loop through multiple iterables of the same length in simultaneously.axes.flatten( ), whereflatten( )is a NumPy array method - this returns a flattened version of our arrays (columns).ax.set( )- allows us to set all of the attributes of ouraxesobject with a single method.
Additional Operations
Nested Loops
Python allows us to use one loop inside another loop. This involves an outer loop that has, inside its commands, an inner loop.
Consider the following structure:
for inner_sequence in sequence:
    for element in inner_sequence:
        # code acting on the element-level goes here
Nested for loops can be useful for iterating through items within lists composed of lists. In a list composed of lists, if we employ just one for loop, the program will output each internal list as an item:
languages = [[<span class="hljs-string">'Spanish'</span>, <span class="hljs-string">'English'</span>,  <span class="hljs-string">'French'</span>, <span class="hljs-string">'German'</span>],
             [<span class="hljs-string">'Python'</span>, <span class="hljs-string">'Java'</span>, <span class="hljs-string">'Javascript'</span>, <span class="hljs-string">'C++'</span>]]

<span class="hljs-keyword">for</span> row <span class="hljs-keyword">in</span> languages:
    print(row)
['Spanish', 'English', 'French', 'German']
['Python', 'Java', 'Javascript', 'C++']In order to access each individual item of the internal lists (i.e., from row), we define a nested for loop to iterate over the outer loop's iteration variable (row):
<span class="hljs-keyword">for</span> row <span class="hljs-keyword">in</span> languages:
    print(<span class="hljs-string">"------"</span>)
    <span class="hljs-keyword">for</span> lang <span class="hljs-keyword">in</span> row:
        print(lang)
------
Spanish
English
French
German
------
Python
Java
Javascript
C++Above, the outer for loop is looping through the main list-of-lists (which contains two lists in this example) and the inner for loop is looping through the individual lists themselves. The outer loop executes 2 iterations (for each sub-list) and at each iteration we execute our inner loop, printing all elements of the respective sub-lists.
This tells us that the control travels from the outermost loop, traverses the inner loop and then back again to the outer for loop, continuing until the control has covered the entire range, which is 2 times in this case.
Continuing and Breaking for Loops
Loop control statements change the execution of a for loop from its normal sequence.
What if we want to filter out a specific language within our inner loop? We can use a continue statement to do this, which allows us to skip over a specific part of our loop when an external condition is triggered.
<span class="hljs-keyword">for</span> x <span class="hljs-keyword">in</span> languages:
    print(<span class="hljs-string">"------"</span>)
    <span class="hljs-keyword">for</span> lang <span class="hljs-keyword">in</span> x:
        <span class="hljs-keyword">if</span> lang == <span class="hljs-string">"German"</span>:
            <span class="hljs-keyword">continue</span>
        print(lang)
------
Spanish
English
French
------
Python
Java
Javascript
C++In our loop above, within the inner loop, if the langauge equals “German”, we skip that iteration only and continue with the rest of the loop. Take note that the loop is not terminated when it runs into a continue statement.
Let’s look at a numerical example next to see how we can use continue to skip particular values in a loop:
<span class="hljs-keyword">from</span> math <span class="hljs-keyword">import</span> sqrt
number = <span class="hljs-number">0</span>

<span class="hljs-keyword">for</span> i <span class="hljs-keyword">in</span> range(<span class="hljs-number">10</span>):
   number = i ** <span class="hljs-number">2</span>

   <span class="hljs-keyword">if</span> i \% <span class="hljs-number">2</span> == <span class="hljs-number">0</span>:
      <span class="hljs-keyword">continue</span>    <span class="hljs-comment"># continue here causes even numbers to be skipped</span>

   print(str(round(sqrt(number))) + <span class="hljs-string">' squared is equal to '</span> + str(number))
1 squared is equal to 1
3 squared is equal to 9
5 squared is equal to 25
7 squared is equal to 49
9 squared is equal to 81So here, we have defined a loop that iterates over all numbers 0 through 9, and squares each number. Within our loop, at each iteration, we are checking if the number is divisible by 2, at which point the loop will continue to execute, skipping the iteration when i is an even number.
What about a break statement? This allows us to exit a loop entirely when an external condition is met. Let’s see a simple demonstration of how this works using the same example as above:
number = <span class="hljs-number">0</span>

<span class="hljs-keyword">for</span> i <span class="hljs-keyword">in</span> range(<span class="hljs-number">10</span>):
   number = i ** <span class="hljs-number">2</span>

   <span class="hljs-keyword">if</span> i == <span class="hljs-number">7</span>:
      <span class="hljs-keyword">break</span>

   print(str(round(sqrt(number))) + <span class="hljs-string">' squared is equal to '</span> + str(number))
0 squared is equal to 0
1 squared is equal to 1
2 squared is equal to 4
3 squared is equal to 9
4 squared is equal to 16
5 squared is equal to 25
6 squared is equal to 36In the above example, our if statement presents the condition that if our variable i evaluates to 7, our loop will break, so our loop iterates over integers 0 through 6 before dropping out of the loop entirely.
Looking for more? Here are some additional resources that might be useful:
- Python Tutorials — Our ever-expanding list of Python tutorials for data science.
- Data Science Career Path — Take your studies to the next level with fully interactive programming, data science, and stats courses, right in your browser.
- Data Analysis and Visualization with Python Skill Path ― Currated learning path that's tailored to those looking for Python data analysis and visualizations skills only.
Next Steps
In this tutorial, we learned about some more advanced applications of for loops, and how they might be used in typical Python data science workflows.
We learned how to iterate over different types of data structures, and how loops can be used with pandas DataFrames and matplotlib to create multiple traces or sub-plots programmatically.
Finally, we looked at some more advanced techniques that give us more control over the operation and execution of our for loops.
If you’d like to learn more about this topic, check out Dataquest's Data Scientist in Python career path that will help you become job-ready in a matter of months.
