
Pandas Tutorial: Data analysis with Python: Part 2
1058 online survey responses collected by FiveThirtyEight. Each survey respondent was asked questions about what they typically eat for Thanksgiving, along with some demographic questions, like their gender, income, and location. This dataset will allow us to discover regional and income-based patterns in what Americans eat for Thanksgiving dinner. As we explore the data and try to find patterns, we'll be heavily using the grouping and aggregation functionality of pandas. 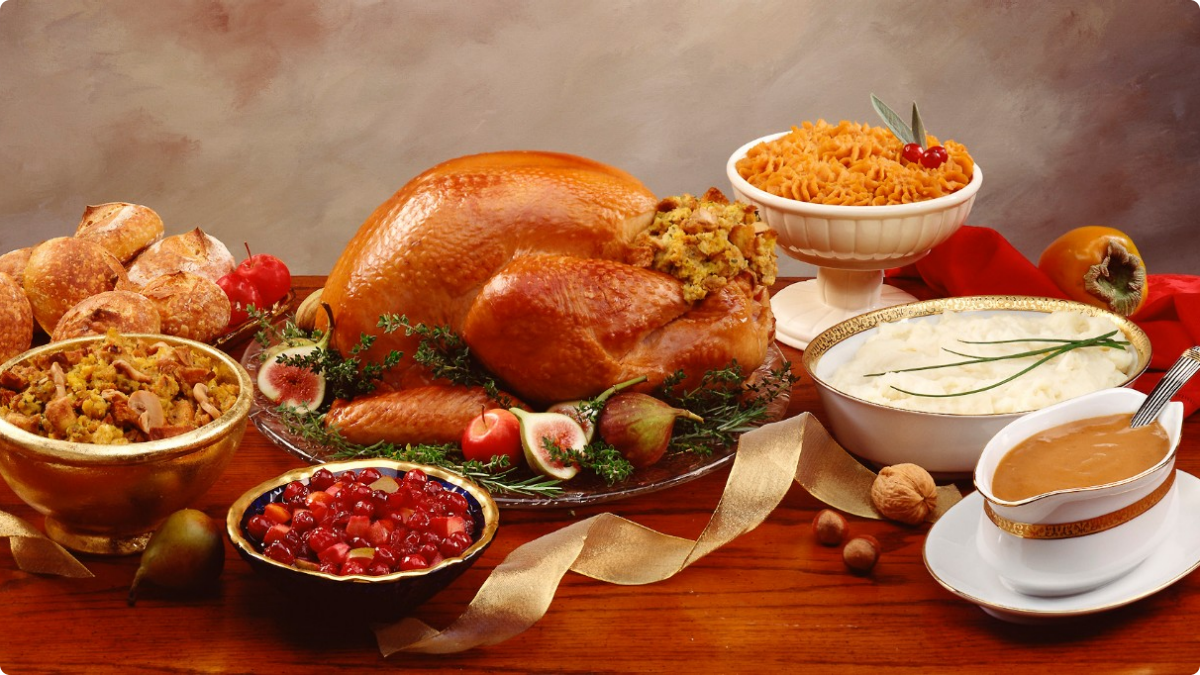
We're very into Thanksgiving dinner in America. Just as a note, we'll be using Python 3.5 and Jupyter Notebook to do our analysis.
Reading in and summarizing the data
Our first step is to read in the data and do some preliminary exploration. This will help us figure out how we want to approach creating groups and finding patterns. As you may recall from part one of this tutorial, we can read in the data using the<a href="https://pandas.pydata.org/pandas-docs/stable/generated/pandas.read_csv.html">pandas.read_csv</a> function. The data is stored using <code>Latin-1</code> encoding, so we additionally need to specify the <code>encoding</code> keyword argument. If we don't, pandas won't be able to load in the data, and we'll get an error: import pandas as pd
data = pd.read_csv("thanksgiving-2015-poll-data.csv", encoding="Latin-1")
data.head()<div class="output_html rendered_html output_subarea output_execute_result">
<div style="overflow-x:auto;">
<table border="1" class="dataframe table table-bordered">
<thead>
<tr style="text-align: right;">
<th>
</th>
<th>
RespondentID
</th>
<th>
Do you celebrate Thanksgiving?
</th>
<th>
What is typically the main dish at your Thanksgiving dinner?
</th>
<th>
What is typically the main dish at your Thanksgiving dinner? - Other (please specify)
</th>
<th>
How is the main dish typically cooked?
</th>
<th>
How is the main dish typically cooked? - Other (please specify)
</th>
<th>
What kind of stuffing/dressing do you typically have?
</th>
<th>
What kind of stuffing/dressing do you typically have? - Other (please specify)
</th>
<th>
What type of cranberry saucedo you typically have?
</th>
<th>
What type of cranberry saucedo you typically have? - Other (please specify)
</th>
<th>
...
</th>
<th>
Have you ever tried to meet up with hometown friends on Thanksgiving night?
</th>
<th>
Have you ever attended a "Friendsgiving?"
</th>
<th>
Will you shop any Black Friday sales on Thanksgiving Day?
</th>
<th>
Do you work in retail?
</th>
<th>
Will you employer make you work on Black Friday?
</th>
<th>
How would you describe where you live?
</th>
<th>
Age
</th>
<th>
What is your gender?
</th>
<th>
How much total combined money did all members of your HOUSEHOLD earn last year?
</th>
<th>
US Region
</th>
</tr>
</thead>
<tbody>
<tr>
<th>
0
</th>
<td>
4337954960
</td>
<td>
Yes
</td>
<td>
Turkey
</td>
<td>
NaN
</td>
<td>
Baked
</td>
<td>
NaN
</td>
<td>
Bread-based
</td>
<td>
NaN
</td>
<td>
None
</td>
<td>
NaN
</td>
<td>
...
</td>
<td>
Yes
</td>
<td>
No
</td>
<td>
No
</td>
<td>
No
</td>
<td>
NaN
</td>
<td>
Suburban
</td>
<td>
18 - 29
</td>
<td>
Male
</td>
<td>
$75,000 to $99,999
</td>
<td>
Middle Atlantic
</td>
</tr>
<tr>
<th>
1
</th>
<td>
4337951949
</td>
<td>
Yes
</td>
<td>
Turkey
</td>
<td>
NaN
</td>
<td>
Baked
</td>
<td>
NaN
</td>
<td>
Bread-based
</td>
<td>
NaN
</td>
<td>
Other (please specify)
</td>
<td>
Homemade cranberry gelatin ring
</td>
<td>
...
</td>
<td>
No
</td>
<td>
No
</td>
<td>
Yes
</td>
<td>
No
</td>
<td>
NaN
</td>
<td>
Rural
</td>
<td>
18 - 29
</td>
<td>
Female
</td>
<td>
$50,000 to $74,999
</td>
<td>
East South Central
</td>
</tr>
<tr>
<th>
2
</th>
<td>
4337935621
</td>
<td>
Yes
</td>
<td>
Turkey
</td>
<td>
NaN
</td>
<td>
Roasted
</td>
<td>
NaN
</td>
<td>
Rice-based
</td>
<td>
NaN
</td>
<td>
Homemade
</td>
<td>
NaN
</td>
<td>
...
</td>
<td>
Yes
</td>
<td>
Yes
</td>
<td>
Yes
</td>
<td>
No
</td>
<td>
NaN
</td>
<td>
Suburban
</td>
<td>
18 - 29
</td>
<td>
Male
</td>
<td>
$0 to $9,999
</td>
<td>
Mountain
</td>
</tr>
<tr>
<th>
3
</th>
<td>
4337933040
</td>
<td>
Yes
</td>
<td>
Turkey
</td>
<td>
NaN
</td>
<td>
Baked
</td>
<td>
NaN
</td>
<td>
Bread-based
</td>
<td>
NaN
</td>
<td>
Homemade
</td>
<td>
NaN
</td>
<td>
...
</td>
<td>
Yes
</td>
<td>
No
</td>
<td>
No
</td>
<td>
No
</td>
<td>
NaN
</td>
<td>
Urban
</td>
<td>
30 - 44
</td>
<td>
Male
</td>
<td>
$200,000 and up
</td>
<td>
Pacific
</td>
</tr>
<tr>
<th>
4
</th>
<td>
4337931983
</td>
<td>
Yes
</td>
<td>
Tofurkey
</td>
<td>
NaN
</td>
<td>
Baked
</td>
<td>
NaN
</td>
<td>
Bread-based
</td>
<td>
NaN
</td>
<td>
Canned
</td>
<td>
NaN
</td>
<td>
...
</td>
<td>
Yes
</td>
<td>
No
</td>
<td>
No
</td>
<td>
No
</td>
<td>
NaN
</td>
<td>
Urban
</td>
<td>
30 - 44
</td>
<td>
Male
</td>
<td>
$100,000 to $124,999
</td>
<td>
Pacific
</td>
</tr>
</tbody>
</table> 5 rows × 65 columns
</div>
</div> As you can see above, the data has
<code>65</code> columns of mostly categorical data. For example, the first column appears to allow for <code>Yes</code> and <code>No</code> responses only. Let's verify by using the <a href="https://pandas.pydata.org/pandas-docs/stable/generated/pandas.Series.unique.html">pandas.Series.unique</a> method to see what unique values are in the <code>Do you celebrate Thanksgiving?</code> column of <code>data</code>: data["Do you celebrate Thanksgiving?"].unique()array(['Yes', 'No'], dtype=object)We can also view all the column names to see all of the survey questions. We’ll truncate the output below to save you from having to scroll:
data.columns[50:]Index(['Which of these desserts do you typically have at Thanksgiving dinner? Please select all that apply. - Other (please specify).1', 'Do you typically pray before or after the Thanksgiving meal?','How far will you travel for Thanksgiving?','Will you watch any of the following programs on Thanksgiving? Please select all that apply. - Macy's Parade','What's the age cutoff at your "kids' table" at Thanksgiving?','Have you ever tried to meet up with hometown friends on Thanksgiving night?','Have you ever attended a "Friendsgiving?"','Will you shop any Black Friday sales on Thanksgiving Day?','Do you work in retail?','Will you employer make you work on Black Friday?', 'How would you describe where you live?', 'Age', 'What is your gender?', 'How much total combined money did all members of your HOUSEHOLD earn last year?', 'US Region'],
dtype='object')Using this Thanksgiving survey data, we can answer quite a few interesting questions, like:
<ul>
  <li>
    Do people in Suburban areas eat more Tofurkey than people in Rural areas?
  </li>
  <li>
    Where do people go to Black Friday sales most often?
  </li>
  <li>
    Is there a correlation between praying on Thanksgiving and income?
  </li>
  <li>
    What income groups are most likely to have homemade cranberry sauce?
  </li>
</ul> In order to answer these questions and others, we'll first need to become familiar with applying, grouping and aggregation in Pandas.

<h2 id="applyingfunctionstoseriesinpandas">
  Applying functions to Series in pandas
</h2> There are times when we're using pandas that we want to apply a function to every row or every column in the data. A good example is getting from the values in our

<code>What is your gender?</code> column to numeric values. We'll assign <code>0</code> to <code>Male</code>, and <code>1</code> to <code>Female</code>. Before we dive into transforming the values, let's confirm that the values in the column are either <code>Male</code> or <code>Female</code>. We can use the <a href="https://pandas.pydata.org/pandas-docs/stable/generated/pandas.Series.value_counts.html">pandas.Series.value_counts</a> method to help us with this. We'll pass the <code>dropna=False</code> keyword argument to also count missing values: data["What is your gender?"].value_counts(dropna=False)Female 544
Male 481
NaN 33
Name: What is your gender?, dtype: int64As you can see, not all of the values are
<code>Male</code> or <code>Female</code>. We'll preserve any missing values in the final output when we transform our column. Here's a diagram of the input and outputs we need: <img src="/wp-content/uploads/2019/01/ditaa_diagram_1-2.png" alt="ditaa_diagram_1-2" /> We'll need to apply a custom function to each value in the <code>What is your gender?</code> column to get the output we want. Here's a function that will do the transformation we want: import math
def gender_code(gender_string):
if isinstance(gender_string, float) and math.isnan(gender_string):
return gender_string
return int(gender_string == "Female")In order to apply this function to each item in the
<code>What is your gender?</code> column, we could either write a for loop, and loop across each element in the column, or we could use the <a href="https://pandas.pydata.org/pandas-docs/stable/generated/pandas.Series.apply.html">pandas.Series.apply</a> method. This method will take a function as input, then return a new pandas Series that contains the results of applying the function to each item in the Series. We can assign the result back to a column in the <code>data</code> DataFrame, then verify the results using <code>value_counts</code>: data["gender"] = data["What is your gender?"].apply(gender_code)
data["gender"].value_counts(dropna=False)1.0 544
0.0 481
NaN 33
Name: gender, dtype: int64<h2 id="applyingfunctionstodataframesinpandas">
Applying functions to DataFrames in pandas
</h2> We can use the
<code>apply</code> method on DataFrames as well as Series. When we use the <a href="https://pandas.pydata.org/pandas-docs/stable/generated/pandas.DataFrame.apply.html">pandas.DataFrame.apply</a> method, an entire row or column will be passed into the function we specify. By default, <code>apply</code> will work across each column in the DataFrame. If we pass the <code>axis=1</code> keyword argument, it will work across each row. In the below example, we check the data type of each column in <code>data</code> using a <a href="https://docs.python.org/3/tutorial/controlflow.html#lambda-expressions">lambda function</a>. We also call the <code>head</code> method on the result to avoid having too much output: data.apply(lambda x: x.dtype).head()RespondentID object
Do you celebrate Thanksgiving? object
What is typically the main dish at your Thanksgiving dinner? object
What is typically the main dish at your Thanksgiving dinner? - Other (please specify) object
How is the main dish typically cooked? object
dtype: object<h2 id="usingtheapplymethodtocleanupincome">
Using the apply method to clean up income
</h2> We can now use what we know about the
<code>apply</code> method to clean up the <code>How much total combined money did all members of your HOUSEHOLD earn last year?</code> column. Cleaning up the income column will allow us to go from string values to numeric values. First, let's see all the unique values that are in the <code>How much total combined money did all members of your HOUSEHOLD earn last year?</code> column: data["How much total combined money did all members of your HOUSEHOLD earn last year?"].value_counts(dropna=False)$25,000 to $49,999 180
Prefer not to answer 136
$50,000 to $74,999 135
$75,000 to $99,999 133
$100,000 to $124,999 111
$200,000 and up 80
$10,000 to $24,999 68
$0 to $9,999 66
$125,000 to $149,999 49
$150,000 to $174,999 40
NaN 33
$175,000 to $199,999 27
Name: How much total combined money did all members of your HOUSEHOLD earn last year?, dtype: int64Looking at this, there are
<code>4</code> different patterns for the values in the column: <ul>
  <li>
    <code>X to Y</code> — an example is <code>$25,000 to $49,999</code>. <ul>
      <li>
        We can convert this to a numeric value by extracting the numbers and averaging them.
      </li>
    </ul>
  </li>

  <li>
    <code>NaN</code> <ul>
      <li>
        We'll preserve <code>NaN</code> values, and not convert them at all.
      </li>
    </ul>
  </li>

  <li>
    <code>X and up</code> — an example is <code>$200,000 and up</code>. <ul>
      <li>
        We can convert this to a numeric value by extracting the number.
      </li>
    </ul>
  </li>

  <li>
    <code>Prefer not to answer</code> <ul>
      <li>
        We'll turn this into an <code>NaN</code> value.
      </li>
    </ul>
  </li>
</ul> Here is how we want the transformations to work:

<img src="/wp-content/uploads/2017/12/ditaa_diagram_2-1.png" alt="ditaa_diagram_2-1" /> We can write a function that covers all of these cases. In the below function, we: <ul>
  <li>
    Take a string called <code>value</code> as input.
  </li>
  <li>
    Check to see if <code>value</code> is <code>$200,000 and up</code>, and return <code>200000</code> if so.
  </li>
  <li>
    Check if <code>value</code> is <code>Prefer not to answer</code>, and return <code>NaN</code> if so.
  </li>
  <li>
    Check if <code>value</code> is <code>NaN</code>, and return <code>NaN</code> if so.
  </li>
  <li>
    Clean up <code>value</code> by removing any dollar signs or commas.
  </li>
  <li>
    Split the string to extract the incomes, then average them.
  </li>
</ul>
import numpy as np
def clean_income(value):
    if value == "$200,000 and up":
        return 200000
    elif value == "Prefer not to answer":
        return np.nan
    elif isinstance(value, float) and math.isnan(value):
        return np.nan
    value = value.replace(",", "").replace("

income_high, income_low = value.split(" to ")
    return (int(income_high) + int(income_low)) / 2
After creating the function, we can apply it to the
<code>How much total combined money did all members of your HOUSEHOLD earn last year?</code> column: data["income"] = data["How much total combined money did all members of your HOUSEHOLD earn last year?"].apply(clean_income)
data["income"].head()0 87499.5
1 62499.5
2 4999.5
3 200000.0
4 112499.5
Name: income, dtype: float64<h2 id="groupingdatawithpandas">
Grouping data with pandas
</h2> Now that we've covered applying functions, we can move on to grouping data using pandas. When performing data analysis, it's often useful to explore only a subset of the data. For example, what if we want to compare income between people who tend to eat homemade cranberry sauce for Thanksgiving vs people who eat canned cranberry sauce? First, let's see what the unique values in the column are:
data["What type of cranberry saucedo you typically have?"].value_counts()Canned 502
Homemade 301
None 146
Other (please specify) 25
Name: What type of cranberry sauce do you typically have?, dtype: int64We can now filter
<code>data</code> to get two DataFrames that only contain rows where the <code>What type of cranberry saucedo you typically have?</code> is <code>Canned</code> or <code>Homemade</code>, respectively: homemade = data[data["What type of cranberry saucedo you typically have?"] == "Homemade"]
canned = data[data["What type of cranberry saucedo you typically have?"] == "Canned"]Finally, we can use the
<a href="https://pandas.pydata.org/pandas-docs/stable/generated/pandas.Series.mean.html">pandas.Series.mean</a> method to find the average income in <code>homemade</code> and <code>canned</code>: print(homemade["income"].mean())
print(canned["income"].mean())94878.1072874
83823.4034091We get our answer, but it took more lines of code than it should have. What if we now want to compute the average income for people who didn’t have cranberry sauce? An easier way to find groupwise summary statistics with pandas is to use the
<a href="https://pandas.pydata.org/pandas-docs/stable/generated/pandas.DataFrame.groupby.html">pandas.DataFrame.groupby</a> method. This method will split a DataFrame into groups based on a column or set of columns. We'll then be able to perform computations on each group. Here's how splitting <code>data</code> based on the <code>What type of cranberry saucedo you typically have?</code> column would look: <img src="/wp-content/uploads/2019/01/ditaa_diagram_3-1.png" alt="ditaa_diagram_3-1" /> Note how each resulting group only has a single unique value in the <code>What type of cranberry saucedo you typically have?</code> column. One group is created for each unique value in the column we choose to group by. Let's create groups from the <code>What type of cranberry saucedo you typically have?</code> column: grouped = data.groupby("What type of cranberry saucedo you typically have?")
grouped<pandas.core.groupby.DataFrameGroupBy object at 0x10a22cc50>As you can see above, the
<code>groupby</code> method returns a <code>DataFrameGroupBy</code> object. We can call the <a href="https://pandas.pydata.org/pandas-docs/stable/generated/pandas.core.groupby.GroupBy.groups.html">pandas.GroupBy.groups</a> method to see what value for the <code>What type of cranberry sauce do you typically have?</code> column is in each group: grouped.groups{'Canned': Int64Index([ 4, 6, 8, 11, 12, 15, 18, 19, 26, 27,
...
1040, 1041, 1042, 1044, 1045, 1046, 1047, 1051, 1054, 1057],
dtype='int64', length=502),
'Homemade': Int64Index([ 2, 3, 5, 7, 13, 14, 16, 20, 21, 23,
...
1016, 1017, 1025, 1027, 1030, 1034, 1048, 1049, 1053, 1056],
dtype='int64', length=301),
'None': Int64Index([ 0, 17, 24, 29, 34, 36, 40, 47, 49, 51,
...
980, 981, 997, 1015, 1018, 1031, 1037, 1043, 1050, 1055],
dtype='int64', length=146),
'Other (please specify)': Int64Index([ 1, 9, 154, 216, 221, 233, 249, 265, 301, 336, 380,
435, 444, 447, 513, 550, 749, 750, 784, 807, 860, 872,
905, 1000, 1007],
dtype='int64')}We can call the
<a href="https://pandas.pydata.org/pandas-docs/stable/generated/pandas.core.groupby.GroupBy.size.html">pandas.GroupBy.size</a> method to see how many rows are in each group. This is equivalent to the <code>value_counts</code> method on a Series: grouped.size()What type of cranberry sauce do you typically have?
Canned 502
Homemade 301
None 146
Other (please specify) 25
dtype: int64We can also use a loop to manually iterate through the groups:
for name, group in grouped:
    print(name)
    print(group.shape)
    print(type(group))
Canned
(502, 67)
<class 'pandas.core.frame.DataFrame'>
Homemade
(301, 67)
<class 'pandas.core.frame.DataFrame'>
None
(146, 67)
<class 'pandas.core.frame.DataFrame'>
Other (please specify)
(25, 67)
<class 'pandas.core.frame.DataFrame'>As you can see above, each group is a DataFrame, and you can use any normal DataFrame methods on it. We can also extract a single column from a group. This will allow us to perform further computations just on that specific column:
grouped["income"]<pandas.core.groupby.SeriesGroupBy object at 0x1081ef390>As you can see above, this gives us a
<code>SeriesGroupBy</code> object. We can then call the normal methods we can call on a <code>DataFrameGroupBy</code> object: grouped["income"].size()What type of cranberry sauce do you typically have?
Canned 502
Homemade 301
None 146
Other (please specify) 25
dtype: int64<h2 id="aggregatingvaluesingroups">
Aggregating values in groups
</h2> If all we could do was split a DataFrame into groups, it wouldn't be of much use. The real power of groups is in the computations we can do after creating groups. We do these computations through the
<a href="https://pandas.pydata.org/pandas-docs/stable/generated/pandas.core.groupby.GroupBy.aggregate.html">pandas.GroupBy.aggregate</a> method, which we can abbreviate as <code>agg</code>. This method allows us to perform the same computation on every group. For example, we could find the average income for people who served each type of cranberry sauce for Thanksgiving (<code>Canned</code>, <code>Homemade</code>, <code>None</code>, etc). In the below code, we: <ul>
<li>
Extract just the <code>income</code> column from <code>grouped</code>, so we don't find the average of every column.
</li>
<li>
Call the <code>agg</code> method with <code>np.mean</code> as input. <ul>
<li>
This will compute the mean for each group, then combine the results from each group.
</li>
</ul>
</li>
</ul>
grouped["income"].agg(np.mean)What type of cranberry sauce do you typically have?
Canned 83823.403409
Homemade 94878.107287
None 78886.084034
Other (please specify) 86629.978261
Name: income, dtype: float64If we left out only selecting the
<code>income</code> column, here's what we'd get: grouped.agg(np.mean)<div class="output_html rendered_html output_subarea output_execute_result">
<div>
<table border="1" class="dataframe table table-bordered">
<thead>
<tr style="text-align: right;">
<th>
</th>
<th>
RespondentID
</th>
<th>
gender
</th>
<th>
income
</th>
</tr>
<tr>
<th>
What type of cranberry sauce do you typically have?
</th>
<th>
</th>
<th>
</th>
<th>
</th>
</tr>
</thead>
<tbody>
<tr>
<th>
Canned
</th>
<td>
4336699416
</td>
<td>
0.552846
</td>
<td>
83823.403409
</td>
</tr>
<tr>
<th>
Homemade
</th>
<td>
4336792040
</td>
<td>
0.533101
</td>
<td>
94878.107287
</td>
</tr>
<tr>
<th>
None
</th>
<td>
4336764989
</td>
<td>
0.517483
</td>
<td>
78886.084034
</td>
</tr>
<tr>
<th>
Other (please specify)
</th>
<td>
4336763253
</td>
<td>
0.640000
</td>
<td>
86629.978261
</td>
</tr>
</tbody>
</table>
</div>
</div> The above code will find the mean for each group for every column in
<code>data</code>. However, most columns are string columns, not integer or float columns, so pandas didn't process them, since calling <code>np.mean</code> on them raised an error. <h2 id="plottingtheresultsofaggregation">
Plotting the results of aggregation
</h2> We can make a plot using the results of our
<code>agg</code> method. This will create a bar chart that shows the average income of each category. In the below code, we: %matplotlib inline
sauce = grouped.agg(np.mean)
sauce["income"].plot(kind="bar")<matplotlib.axes._subplots.AxesSubplot at 0x109ebacc0><div class="output_png output_subarea ">
<img src="data:image/png;base64,iVBORw0KGgoAAAANSUhEUgAAAh8AAAIFCAYAAAByEJ8sAAAABHNCSVQICAgIfAhkiAAAAAlwSFlzAAAPYQAAD2EBqD+naQAAIABJREFUeJzs3XmYJWV9t/H7yy4oA4osLgi44Ji4wCiCgpqgIHGNmui4QFSM+zK+LjExQkQTlwiCoBJwRydxX+IyKiEuiBIYRJQBRJZREXAUBwRZhN/7R1XLmUNPTw+crjrdfX+uq6+Z89Rzqn5n6dPfU/XUU6kqJEmSurJB3wVIkqT5xfAhSZI6ZfiQJEmdMnxIkqROGT4kSVKnDB+SJKlThg9JktQpw4ckSeqU4UOSJHXK8CFJkjq13uEjyT5Jvpjkl0luSvLESfq8OcklSa5J8o0k9xpavnWSjydZneSKJMcn2WKozwOSfDvJH5JcnOS1k2znb5KsaPucmeSA9a1FkiR169bs+dgC+CHwUuAWF4ZJ8nrgZcALgT2Aq4FlSTYZ6PYJYCGwL/A44BHAsQPruAOwDLgQ2B14LXBokoMH+uzVruc44EHA54HPJ7nfetYiSZI6lNtyYbkkNwFPrqovDrRdAryzqo5ob28JXAYcVFWfTLIQ+AmwqKrOaPvsD3wZuFtVXZrkxcBhwPZV9ce2z78BT6qq+7W3/xPYvKqeOLDtU4Azquol06nlVj9wSZJ0q410zEeSnYHtgRMn2qrqSuAHwF5t057AFRPBo/VNmr0oDx3o8+2J4NFaBuyaZEF7e6/2fgz12autZZdp1CJJkjo26gGn29OEiMuG2i9rl030uXxwYVXdCPx2qM9k62AafSaWbzeNWiRJUsc26mg7YZLxIevZJ9Psc6u3k+ROwP7ARcC161iPJEm62WbATsCyqvrNVB1HHT4upfnjvh1r7nHYFjhjoM+2g3dKsiGwdbtsos92Q+veljX3ZKytz+DyddUybH/g42tZJkmS1u1ZNCeErNVIw0dVXZjkUpqzWH4Efxrk+VDgmLbbKcBWSXYbGPexL01QOHWgz1uSbNgekgHYDzi3qlYP9NkXOGqghMe07dOtZdhFACeccAILFy5c/ydgFlmyZAlHHHFE32VohHxN5xZfz7llPryeK1as4NnPfja0f0unst7ho52P4140YQFglyQPBH5bVT8H3g28Mcn5bQGHAb8AvgBQVeckWQYc157VsgnwHmBpVU3s+fgE8Cbgg0neDtwfeAXwyoFSjgS+leTVNGfKLAYWAS8Y6DNlLZO4FmDhwoXsvvvu6/nMzC4LFiyY849xvvE1nVt8PeeWefZ6rnPYwq3Z8/Fg4CSaQyAFvKtt/wjwvKp6R5LNaebt2Ar4DnBAVV0/sI5nAkfTnK1yE/BpBoJFVV3Znn57NHAasAo4tKo+MNDnlCSLgbe2Pz+lORX37IE+06lFkiR1aL3DR1V9i3WcJVNVhwKHTrH8d8Cz17GOs4BHrqPPZ4DP3JZaJElSt7y2iyRJ6pThY55avHhx3yVoxHxN5xZfz7nF13NNt2l69bkmye7A6aeffvp8GhgkSdJttnz5chYtWgTN5VOWT9XXPR+SJKlThg9JktQpw4ckSeqU4UOSJHXK8CFJkjpl+JAkSZ0yfEiSpE6N9Kq2kmDlypWsWrWq7zI6sc0227Djjjv2XYakWcbwIY3QypUr2XXXhVx77TV9l9KJzTbbnHPPXWEAkbReDB/SCK1ataoNHicAC/suZ4at4Nprn82qVasMH5LWi+FDmhELAafol6TJOOBUkiR1yvAhSZI6ZfiQJEmdMnxIkqROGT4kSVKnDB+SJKlThg9JktQpw4ckSeqU4UOSJHXK8CFJkjpl+JAkSZ0yfEiSpE4ZPiRJUqcMH5IkqVOGD0mS1CnDhyRJ6pThQ5IkdcrwIUmSOmX4kCRJnTJ8SJKkThk+JElSpzbquwBJkrq0cuVKVq1a1XcZM26bbbZhxx137LuMSRk+JEnzxsqVK9l114Vce+01fZcy4zbbbHPOPXfFWAYQw4ckad5YtWpVGzxOABb2Xc4MWsG11z6bVatWGT4kSRoPC4Hd+y5i3nLAqSRJ6pThQ5IkdcrwIUmSOmX4kCRJnTJ8SJKkTnm2yxhwwhtJ0nxi+OiZE95IkuYbw0fPnPBGkjTfGD7GhhPeSJLmBwecSpKkThk+JElSpwwfkiSpUyMPH0k2SHJYkguSXJPk/CRvnKTfm5Nc0vb5RpJ7DS3fOsnHk6xOckWS45NsMdTnAUm+neQPSS5O8tpJtvM3SVa0fc5McsCoH7MkSZq+mdjz8Q/AC4GXAPcFXge8LsnLJjokeT3wsrbfHsDVwLIkmwys5xM0ozD3BR4HPAI4dmAddwCWARfSjNR8LXBokoMH+uzVruc44EHA54HPJ7nfaB+yJEmarpkIH3sBX6iqr1XVyqr6LPB1mpAx4ZXAYVX1par6MXAgcBfgyQBJFgL7A8+vqtOq6nvAy4FnJNm+XcezgY3bPiuq6pPAUcCrh7bz1ao6vKrOrapDgOU0wUeSJPVgJsLH94B9k9wbIMkDgYcDX2lv7wxsD5w4cYequhL4AU1wAdgTuKKqzhhY7zeBAh460OfbVfXHgT7LgF2TLGhv79Xej6E+eyFJknoxE/N8vA3YEjgnyY00Aeefquo/2+Xb04SIy4bud1m7bKLP5YMLq+rGJL8d6nPBJOuYWLa6/Xeq7UiSpI7NRPh4OvBM4BnA2TRjLY5McklVfWyK+4UmlExlXX0yzT7r2o4kSZohMxE+3gH8a1V9qr39kyQ7AW8APgZcShMAtmPNvRLbAhOHWS5tb/9Jkg2BrdtlE322G9r2tqy5V2VtfYb3hqxhyZIlLFiwYI22xYsXs3jx4qnuJknSvLB06VKWLl26Rtvq1aunff+ZCB+bc8s9CzfRji+pqguTXEpzFsuPAJJsSTOW45i2/ynAVkl2Gxj3sS9NaDl1oM9bkmxYVTe2bfsB51bV6oE++9IMRJ3wmLZ9rY444gh2392pziVJmsxkX8iXL1/OokWLpnX/mQgfXwL+KcnPgZ/QnAa7BDh+oM+7gTcmOR+4CDgM+AXwBYCqOifJMuC4JC8GNgHeAyytqok9H58A3gR8MMnbgfsDr6A5w2XCkcC3krwa+DKwGFgEvGDUD1rS3LVy5UpWrVrVdxkzbptttvHCj+rETISPl9GEiWNoDnFcAryvbQOgqt6RZHOaeTu2Ar4DHFBV1w+s55nA0TRnq9wEfJqBYFFVVybZv+1zGrAKOLSqPjDQ55Qki4G3tj8/BZ5UVWeP+kFLmptWrlzJrrsubK8+PbdtttnmnHvuCgOIZtzIw0dVXU0z18ar19HvUODQKZb/jmYuj6nWcRbwyHX0+Qzwman6SNLarFq1qg0eJ9DMezhXreDaa5/NqlWrDB+acTOx50OS5qCFNEeRJd1WXlhOkiR1yvAhSZI6ZfiQJEmdMnxIkqROGT4kSVKnDB+SJKlThg9JktQpw4ckSeqU4UOSJHXK8CFJkjpl+JAkSZ0yfEiSpE4ZPiRJUqcMH5IkqVOGD0mS1CnDhyRJ6pThQ5IkdcrwIUmSOmX4kCRJnTJ8SJKkThk+JElSpwwfkiSpU4YPSZLUKcOHJEnqlOFDkiR1yvAhSZI6ZfiQJEmdMnxIkqROGT4kSVKnDB+SJKlThg9JktQpw4ckSeqU4UOSJHXK8CFJkjpl+JAkSZ0yfEiSpE4ZPiRJUqcMH5IkqVOGD0mS1CnDhyRJ6pThQ5IkdcrwIUmSOmX4kCRJnTJ8SJKkThk+JElSpwwfkiSpU4YPSZLUKcOHJEnqlOFDkiR1yvAhSZI6NSPhI8ldknwsyaok1yQ5M8nuQ33enOSSdvk3ktxraPnWST6eZHWSK5Icn2SLoT4PSPLtJH9IcnGS105Sy98kWdH2OTPJATPxmCVJ0vSMPHwk2Qo4GbgO2B9YCPw/4IqBPq8HXga8ENgDuBpYlmSTgVV9or3vvsDjgEcAxw6s4w7AMuBCYHfgtcChSQ4e6LNXu57jgAcBnwc+n+R+I33QkiRp2jaagXX+A7Cyqg4eaLt4qM8rgcOq6ksASQ4ELgOeDHwyyUKa4LKoqs5o+7wc+HKS11TVpcCzgY2B51fVH4EVSXYDXg0cP7Cdr1bV4e3tQ5LsRxN8XjLSRy1JkqZlJg67PAE4Lcknk1yWZPnQ3oidge2BEyfaqupK4AfAXm3TnsAVE8Gj9U2ggIcO9Pl2GzwmLAN2TbKgvb1Xez+G+uyFJEnqxUyEj12AFwPnAvsB7weOSvLsdvn2NCHisqH7XdYum+hz+eDCqroR+O1Qn8nWwTT6bI8kSerFTBx22QA4tar+ub19ZpI/owkkJ0xxv9CEkqmsq0+m2Wdd25EkSTNkJsLHr4AVQ20rgKe0/7+UJgBsx5p7JbYFzhjos+3gCpJsCGzdLpvos93QdrZlzb0qa+szvDdkDUuWLGHBggVrtC1evJjFixdPdTdJkuaFpUuXsnTp0jXaVq9ePe37z0T4OBnYdahtV9pBp1V1YZJLac5i+RFAki1pxnIc0/Y/BdgqyW4D4z72pQktpw70eUuSDdtDMtAc5jm3qlYP9NkXOGqglse07Wt1xBFHsPvuu0/VRZKkeWuyL+TLly9n0aJF07r/TIz5OALYM8kbktwzyTOBg4GjB/q8G3hjkickuT/wUeAXwBcAquocmoGhxyV5SJKHA+8BlrZnukBzCu31wAeT3C/J04FXAO8a2M6RwAFJXp1k1ySHAouGapEkSR0aefioqtOAvwYWA2cB/wS8sqr+c6DPO2jCxLE0Z7ncDjigqq4fWNUzgXNozlb5b+DbNPOCTKzjSprTcXcCTgPeCRxaVR8Y6HNKW8ffAz+kOfTzpKo6e6QPWpIkTdtMHHahqr4CfGUdfQ4FDp1i+e9o5vKYah1nAY9cR5/PAJ+Zqo8kSeqO13aRJEmdMnxIkqROGT4kSVKnDB+SJKlThg9JktQpw4ckSeqU4UOSJHXK8CFJkjpl+JAkSZ0yfEiSpE4ZPiRJUqcMH5IkqVOGD0mS1CnDhyRJ6pThQ5IkdcrwIUmSOmX4kCRJnTJ8SJKkThk+JElSpwwfkiSpU4YPSZLUKcOHJEnqlOFDkiR1yvAhSZI6ZfiQJEmdMnxIkqROGT4kSVKnDB+SJKlThg9JktQpw4ckSeqU4UOSJHXK8CFJkjpl+JAkSZ0yfEiSpE4ZPiRJUqcMH5IkqVOGD0mS1CnDhyRJ6pThQ5IkdcrwIUmSOmX4kCRJnTJ8SJKkThk+JElSpwwfkiSpU4YPSZLUKcOHJEnqlOFDkiR1yvAhSZI6ZfiQJEmdMnxIkqROGT4kSVKnZjx8JHlDkpuSHD7QtmmSY5KsSnJVkk8n2XbofndP8uUkVye5NMk7kmww1OdRSU5Pcm2S85IcNMn2X5rkwiR/SPL9JA+ZuUcrSZLWZUbDR/uH/gXAmUOL3g08Dngq8AjgLsBnBu63AfAVYCNgT+Ag4O+ANw/02Qn4b+BE4IHAkcDxSR4z0OfpwLuAQ4Dd2jqWJdlmZA9SkiStlxkLH0luD5wAHAz8bqB9S+B5wJKq+lZVnQE8F3h4kj3abvsD9wWeVVVnVdUy4J+BlybZqO3zYuCCqnpdVZ1bVccAnwaWDJSxBDi2qj5aVecALwKuabcvSZJ6MJN7Po4BvlRV/zPU/mCaPRonTjRU1bnASmCvtmlP4KyqWjVwv2XAAuDPBvp8c2jdyybWkWRjYNHQdqq9z15IkqRebLTuLusvyTOAB9EEjWHbAddX1ZVD7ZcB27f/3769Pbx8YtmZU/TZMsmmwB2BDdfSZ9fpPRJJkjRqIw8fSe5GM6bjMVV1w/rcFahp9JuqT6bZZzrbkSRJM2Am9nwsAu4MnJ5kIgxsCDwiycuAxwKbJtlyaO/Htty8l+JSYPislO0Glk38u91Qn22BK6vq+iSrgBvX0md4b8galixZwoIFC9ZoW7x4MYsXL57qbpIkzQtLly5l6dKla7StXr162vefifDxTeD+Q20fBlYAbwN+CdwA7At8DiDJfYAdge+1/U8B/jHJNgPjPvYDVrfrmehzwNB29mvbqaobkpzebueL7XbS3j5qqgdwxBFHsPvuu0/v0UqSNM9M9oV8+fLlLFq0aFr3H3n4qKqrgbMH25JcDfymqla0tz8AHJ7kCuAqmjBwclX9X3uXr7fr+FiS1wM7AIcBRw8cynk/8LIkbwc+SBMqngb81cCmDwc+0oaQU2nOftmcJgxJkqQezMiA00kMj7FYQnNI5NPApsDXgJf+qXPVTUkeD7yPZm/I1TSB4ZCBPhcleRxNwHgF8Avg+VX1zYE+n2zn9HgzzeGXHwL7V9WvR/0AJUnS9HQSPqrqL4duXwe8vP1Z231+Djx+Hev9Fs0Yk6n6vBd477SLlSRJM8pru0iSpE4ZPiRJUqcMH5IkqVOGD0mS1CnDhyRJ6pThQ5IkdcrwIUmSOmX4kCRJnTJ8SJKkThk+JElSpwwfkiSpU4YPSZLUKcOHJEnqlOFDkiR1yvAhSZI6ZfiQJEmdMnxIkqROGT4kSVKnDB+SJKlThg9JktQpw4ckSeqU4UOSJHXK8CFJkjpl+JAkSZ0yfEiSpE4ZPiRJUqcMH5IkqVOGD0mS1CnDhyRJ6pThQ5IkdcrwIUmSOmX4kCRJnTJ8SJKkThk+JElSpwwfkiSpU4YPSZLUKcOHJEnqlOFDkiR1yvAhSZI6ZfiQJEmdMnxIkqROGT4kSVKnDB+SJKlThg9JktQpw4ckSeqU4UOSJHXK8CFJkjpl+JAkSZ0yfEiSpE4ZPiRJUqcMH5IkqVMjDx9J3pDk1CRXJrksyeeS3Geoz6ZJjkmyKslVST6dZNuhPndP8uUkVye5NMk7kmww1OdRSU5Pcm2S85IcNEk9L01yYZI/JPl+koeM+jFLkqTpm4k9H/sA7wEeCjwa2Bj4epLbDfR5N/A44KnAI4C7AJ+ZWNiGjK8AGwF7AgcBfwe8eaDPTsB/AycCDwSOBI5P8piBPk8H3gUcAuwGnAksS7LN6B6uJElaHxuNeoVV9VeDt5P8HXA5sAj4bpItgecBz6iqb7V9ngusSLJHVZ0K7A/cF/iLqloFnJXkn4G3JTm0qv4IvBi4oKpe127q3CR7A0uAb7RtS4Bjq+qj7XZeRBN6nge8Y9SPXZIkrVsXYz62Agr4bXt7EU3oOXGiQ1WdC6wE9mqb9gTOaoPHhGXAAuDPBvp8c2hbyybWkWTjdluD26n2PnshSZJ6MaPhI0loDrF8t6rObpu3B66vqiuHul/WLpvoc9kky5lGny2TbApsA2y4lj7bI0mSejHywy5D3gvcD9h7Gn1Ds4dkXabqk2n2mc52JEnSDJix8JHkaOCvgH2q6pKBRZcCmyTZcmjvx7bcvJfiUmD4rJTtBpZN/LvdUJ9tgSur6vokq4Ab19JneG/IGpYsWcKCBQvWaFu8eDGLFy+e6m6SJM0LS5cuZenSpWu0rV69etr3n5Hw0QaPJwGPrKqVQ4tPB/4I7At8ru1/H2BH4Httn1OAf0yyzcC4j/2A1cCKgT4HDK17v7adqrohyentdr7Ybift7aOmqv+II45g9913n/bjlSRpPpnsC/ny5ctZtGjRtO4/8vCR5L3AYuCJwNVJJvY8rK6qa6vqyiQfAA5PcgVwFU0YOLmq/q/t+3XgbOBjSV4P7AAcBhxdVTe0fd4PvCzJ24EP0oSKp9HsbZlwOPCRNoScSnP2y+bAh0f9uCVJ0vTMxJ6PF9GMqfjfofbnAh9t/7+E5pDIp4FNga8BL53oWFU3JXk88D6avSFX0wSGQwb6XJTkcTQB4xXAL4DnV9U3B/p8sp3T4800h19+COxfVb8e0WOVJEnraSbm+VjnGTRVdR3w8vZnbX1+Djx+Hev5Fs3ptFP1eS/NwFdJkjQGvLaLJEnqlOFDkiR1yvAhSZI6ZfiQJEmdMnxIkqROGT4kSVKnDB+SJKlThg9JktQpw4ckSeqU4UOSJHXK8CFJkjpl+JAkSZ0yfEiSpE4ZPiRJUqcMH5IkqVOGD0mS1CnDhyRJ6pThQ5IkdcrwIUmSOmX4kCRJnTJ8SJKkThk+JElSpwwfkiSpU4YPSZLUKcOHJEnqlOFDkiR1yvAhSZI6ZfiQJEmdMnxIkqROGT4kSVKnDB+SJKlThg9JktQpw4ckSeqU4UOSJHXK8CFJkjpl+JAkSZ0yfEiSpE4ZPiRJUqcMH5IkqVOGD0mS1CnDhyRJ6pThQ5IkdcrwIUmSOmX4kCRJnTJ8SJKkThk+JElSpwwfkiSpU4YPSZLUKcOHJEnqlOFDkiR1yvAhSZI6NS/CR5KXJrkwyR+SfD/JQ/quqX9L+y5AI+drOrf4es4tvp6D5nz4SPJ04F3AIcBuwJnAsiTb9FpY7/xFmHt8TecWX8+5xddz0JwPH8AS4Niq+mhVnQO8CLgGeF6/ZUmSND/N6fCRZGNgEXDiRFtVFfBNYK++6pIkaT6b0+ED2AbYELhsqP0yYPvuy5EkSRv1XUBPAtQk7ZsBrFixorNCbt7WV4Dutgu/AD7e4fYuBLp9bvvQ3+sJvqYzw9/RucXXc+YMbGuzdfVNcxRibmoPu1wDPLWqvjjQ/mFgQVX99VD/Z9Ltu0OSpLnmWVX1iak6zOk9H1V1Q5LTgX2BLwIkSXv7qEnusgx4FnARcG1HZUqSNBdsBuxE87d0SnN6zwdAkr8FPgK8EDiV5uyXpwH3rapf91mbJEnz0Zze8wFQVZ9s5/R4M7Ad8ENgf4OHJEn9mPN7PiRJ0niZ66faSpKkMWP4kCRJnZrzYz4kSepSkp2BfYB7AJsDvwbOAE6pKs+kxDEfkiSNRJJnAa8EHkwzk/YlwB+AOwL3pJnC4ePA26vq4r7qHAfu+ZjDklzB5DO53kJV3XGGy9EMSHJP4Lk0H2yvrKrLkxwArKyqn/RbndZXko2AR9G8np+oqquS3AW4sqp+32txmlKSM4DrgQ/TTGz586Hlm9JcU+wZwGlJXlJVn+q80DHhno85LMlBAzfvBLyRZvKXU9q2vYD9gcOq6oiOy9NtlOSRwFeBk4FHAAur6oIk/wA8uKqe1muBWi9J7gF8DdgR2BS4T/t6HglsWlUv6rVATSnJY6vqa9Pseydgp6o6fYbLGluGj3kiyWeAk6rq6KH2lwGPrqon91OZbq0kpwCfqqrDk1wFPLD9Y7UH8LmqumvPJWo9JPk8cBXwfOA33Px6Pgo4rqru3Wd90ih5tsv8sT/Nt6phXwMe3XEtGo37A5+bpP1ymj1dml32Bt5SVdcPtV8EGCRnkST/m+TAJLfru5ZxZfiYP34DPGmS9ie1yzT7/A7YYZL23YBfdlyLbrsN259hd6PZI6LZ40zg34FLkxyXZM++Cxo3ho/54xDg7Um+lOSNSf4pyZeAt7XLNPv8J81ruj3NwOINkjyc5kPvo71Wplvj68CrBm5XktsD/0Jz/XfNElX1SuAuNIPBtwW+neTsJK9Jsl2/1Y0Hx3zMI0keCrwCWAgEOBs4qqp+0GthulWSbAIcA/wdzTfmP7b/fgL4u6q6sb/qtL6S3I1mQHiAewOntf+uAh5RVZf3WJ5ugyTbAn8P/BPN7+hXaD57/6fXwnpk+JBmuSQ7An8O3B44o6p+2nNJupXaU22fATyA5vVcDny8qv7Qa2G61doB4M8FFgOraU7FvSvwTOC9VfWa/qrrj+FjHhmYE2IX4FXOCSFJo9fu6XgOzeftvYEvAccDy6r9o5tkb+BrVXX73grtkZOMzROTzAnxRpqzIh5Ic2qfc0LMAkkOn27fqnr1TNai0UtyH5pJxrZlaExeVb25j5p0q/wC+BnwQeDDVfXrSfr8CPi/TqsaI+75mCecE2JuSHLSUNMimmPI57a37wPcCJxeVX/ZZW26bZK8AHgfzRiPS1lzduKqqt17KUzTkuSJwFer6oYk+1TVd/quaZwZPuaJJL8H7l9VFw6Fj52Ac6pqs14L1HpL8mqab8kHVdUVbdvWwIeA71TVu3osT+spycU0YwDe3nctWn9JbgS2r6pft//fwUHCa+eptvOHc0LMPf8PeMNE8ABo///Gdplml62BeXutjzng18DEfB5hmtfVmq8MH/OHc0LMPVsCd56k/c7AHTquRbfdp4D9+i5Ct9r7gS+0ez2KZoKxGyf76bnOseBhl3nCOSHmniQfBfah2ctxKs0H3p7AO2kOuxw0xd01ZpK8AXg18GXgLOCGweVVdVQfdWn6ktwXuBfwRZozXX43Wb+q+kKXdY0jw8c845wQc0eSzWn2XD0P2Lht/iPwAeC1VXV1X7Vp/SW5cIrFVVW7dFaMbpMkhwDvrKpr+q5lXBk+pFkuyRbAPWmOM59v6JA07gwf80SSDWkOuezL5HMIeFqmNCaSBJrdHX3XoulJshzYt6quSHIGUww49bRpJxmbT46kCR9fBn6MI7HnhCQPAf4G2BHYZHBZVT2ll6J0qyU5EHgtzayYJDmPZvf9x3otTNPxBeC69v+f77OQ2cA9H/NEklXAgVXl1THniCTPoDlTaRnNWRJfp/mjtT3NxHHP7bE8rad23pbDgKNpZiIO8HDgpcAbq+qIHsuTRsrwMU8kuQR4VFWd13ctGo0kPwKOrapjJiaOAy4EjgV+VVWH9Fqg1ks74PSQqvroUPtBwKFVtXM/lWl9tXskNxi+Ynh7ZfEbq+q0fiobH87zMX+8C3jlxLFkzQn3pDmMBnA9sEU7RuAImst3a3bZAfjeJO3fY/IJAjW+jgHuPkn7Xdtl855jPuaPvYG/AA5I8hNuOYeA4wNmn99y82Riv6Q5hfosYCtg876K0q12PvC3wL8OtT8d8JT42eV+wPJJ2s9ol817ho/543fA5/ouQiP1HeAxNIHjU8CRSf6ybTuxz8J0qxwC/FeSR9CM+SiaLw370oQSzR7XAdsBFwy170AzF8+855gPaZZKckdgs6q6JMkGwOuAh9F8S37L4DVfNDskWUQzy+l9aQacng28q6rO6LUwrZckS2mCxpOqanXbthXNWTCXV9W8D5OGD0mSRijJXYFvA3eiOdQC8CDgMuALJsKkAAAdhElEQVQxVfXzvmobF4aPeSLJdjRTcU9MMrbGwNOq2rCPunTbJdmWySeO+1E/FWl9JLmJdc+7U1XlYfJZpJ15+Fk0Z6H9AfgRsLSqbpjyjvOE4WOeSPJVmomojgZ+xdCHnRc6mn3aXfQfARYyFCZp/lgZKGeBJE+aYvHDgJfTfFbfrqOSpBln+Jgn2nkg9qmqH/Zdi0YjyZnAz4C30+zOHQ6UF/dRl2679uqo/wY8Afg48M9VtbLfqrQ+kjwHeCGwC7BXVV2cZAlwgV/2nOdjPvk5t/x2rNltF+B1VfWDqrqoqi4e/Om7OK2/JHdJchzNLvqNgAdV1UEGj9klyYuBw4GvAlsDE3shrwBe1Vdd48TwMX+8Cnhbkp16rkOjcyLN8WTNckkWJHk7zVwff0ZzgbInVNWPey5Nt87LgRdU1VtZ89Ta04D791PSeHEA0/zxXzQTT/0syTXccpKxO/ZSlW6Lg4GPJPlzmosFDr+mX+ylKq2XJK8DXg9cCix2l/ycsDM3n+Uy6Dpgi45rGUuGj/nDXX1zz140Fx47YJJlxc27ejXe3kZzNsT5wEHttVxuwVmIZ5ULaU6tHT78+VhgRffljB/DxzxRVR/puwaN3HuAE4DDquqyvovRrfZR1n2qrWaXw4FjkmxGM9ZujySLgTfQ7LGc9zzbZR5Kcjtg48G2qrqyp3J0K7VnMD2oqn7Wdy2S1pTkWcChNBeAhOb6S4dW1Qd6K2qMGD7miXbCm7fTXCPiTsPLnRNi9knyEeA7VXV837VImlySzYHbV9XlfdcyTjzsMn+8g+aqti8GPga8lObyzi8E/qHHunTrnQf8W5K9aS4uNzzg9KheqpIE/Gn24V2BSlJV9eu+axoX7vmYJ5KsBA6sqv9NciWwe1Wd306Es7iq/qrnErWeklw4xeKqql06K0bSnyS5A/BeYDE3T2lxI81Zhy+duNjcfOaej/njjjQjsAGubG8DfBd4Xy8V6Tapqp37rkHSpI4HdgMeB5xCM6D4YcCRwLHAM/orbTw4ydj8cQGwU/v/c2jGfkAzffPv+ihIo5FkkyS7JvHLhDQeHg88r6qWVdWVVXVVVS0DXkDzmTvvGT7mjw9x82yYbwNemuQ64N3AO3urSrdaks2TfAC4BvgJzYUDSfKeJI7jkfrzG2CyQyuraaZYn/cc8zFPJbkHsAj4aVWd1Xc9Wn9JjqSZZOxVwNeAB1TVBe1VUg+tqt16LVCap5L8PfA3NOPsftW2bU9zFerPVtWxfdY3Dgwfc1ySvwSOBvYcnssjyQLge8CLquo7fdSnWy/JxcDTq+r77ZwfD2zDx72A5VW1Zc8lSvNSkjOAewGbAhMXBdyRZnr1nw72rardu61uPHiMeO57FXDcZJOIVdXqJMcCrwYMH7PPnYHJ5g7YAmfMlPr0+b4LGHeGj7nvgTQXrVqbrwOv6agWjdZpNKPp39PenggcB9OMsJfUg6r6l75rGHeGj7lvO4YmnxryR5pv0Jp9/hH4apL70fwuvzLJn9FccO6RvVYmzWNJ7k4z184v2tt7AM8Ezq6q/+i1uDHh2S5z3y+B+0+x/AHArzqqRSNUVd+luXLmRjQznO4HXAbsVVWn91mbNM99gmZG6YmBpt8E9gDemuRNfRY2LhxwOscleQ/wKOAhVXXt0LLbAacCJ1XVK3ooT5LmnCRX0AzyPzfJK2gGhj88yX7A+5192MMu88FbgKcA5yU5GjiXZmzAQprru2wIvLW/8nRbtdeP2JahPZlV9aN+KpLmvY1pzmwBeDTwxfb/5wA79FLRmHHPxzzQzunxPmB/IG1zAcuAl1TVRT2VptsgySKaeQMWcvPrOqG8UrHUjyQ/AE4CvkwzqH/PqjozyZ7Ap6vqbr0WOAYMH/NIkq1pzj0PzeRizrQ3iyU5E/gZ8HaasR5r/DJX1cV91CXNd0keBXwO2BL4SFU9r23/V+C+VfWUHssbC4YPaZZqJxbbrarO77sWSWtKsiGw5eCXvCQ7AddU1WTz88wrnu0izV4ncvP1eiSNkaq6cXjvclVdZPBouOdDmqWSbEMz5uNU4McMzedSVV+c7H6S1DfPdpFmr71oLix3wCTLiuZMJkkaOx52kWav9wAnADtU1QZDPwYPSWPLwy7SLNUOOH1QVf2s71okTS7JZsMTPMo9H9Js9lnaKZwljY8kGyT55yS/BH6fZJe2/bAkz++5vLHgmA9p9joP+Lcke9Nc22V4wOlRvVQl6Y3AQcDrgOMG2n8MvAr4QB9FjRMPu0izVJILp1hcXj9C6keS84EXVtWJ7eHRB1bVBUnuC5xSVVv3XGLv3PMhzVJVtXPfNUia1F2BySb/24Dmui/znmM+pDkgrb7rkATA2cA+k7Q/DTij41rGkns+pFksyYHAa4F7t7fPA95ZVR/rtTBpfnsz8JEkd6X5kv+UJLsCBwKP77WyMeGeD2mWSvJqmqsVfwX4W+DpwNeA9ydZ0mdt0nxWVV+gCRmPBq6mCSMLgSdU1Tf6rG1cOOBUmqXaAaeHVNVHh9oPAg51TIikceWeD2n22gH43iTt32uXSepBkrsnudvA7T2SvDvJ3/dZ1zgxfEiz1/k0h1uGPR34ace1SLrZJ2gnAEyyPfBNYA/grUne1Gdh48IBp9LsdQjwX0keAZxMczG5vYF9mTyUSOrGn9NcbRqa38WzqurhSfYD3k8zBmRec8+HNEtV1WeAhwKrgCcDT2n/v0dVfa7P2qR5bmPguvb/jwa+2P7/HDwkCjjgVJp1kmw5nX5VdeVM1yLplpL8ADgJ+DLwdWDPqjozyZ7Ap6vqblOuYB7wsIs0+/yO5hDLumw404VImtTrgc/RzMHzkao6s21/IjcfjpnX3PMhzTJJHjl4k2aej4OBXw72q6pvdVmXpJsl2RDYsqquGGjbCbimqi7vq65xYfiQZrnBC1f1XYskTYeHXSRJGrEkT6M502VHYJPBZVW1ey9FjRHPdpEkaYSSvAL4EHAZsBvNOI/fALsAX+2xtLFh+JDmBo+fSuPjJcDfV9XLgeuBd1TVY4CjgAW9VjYmPOwizTJJPjvUtBnNxeSuHmysqqd0V5WkATty86UP/gDcof3/x4DvAy/ro6hxYviQZp/VQ7dP6KUKSWtzKXAn4GJgJbAncCawM80ZavOe4UOaZarquX3XIGlK/wM8AVhOM/bjiHYA6oOB4T2X85Kn2kqSNEJJNgA2qKo/trefATyM5oKPx1bV9X3WNw4MH5IkqVOe7SJJ0ogl2SfJCUlOSXLXtu05Sfbuu7ZxYPiQJGmEkjwVWEZzpstuwKbtogXAP/ZV1zgxfEiSNFpvBF5UVS8AbhhoPxmY97ObguFDkqRR2xX49iTtq4GtOq5lLBk+JEkarUuBe03SvjfgBSAxfEiSNGrHAUcmeSjNpQ/ukuRZwL8D7+21sjHhJGOSJI3W22i+3J8IbE5zCOY64N+r6ug+CxsXzvMhSdIMSLIJzeGX2wNnV9Xvey5pbBg+JElSpzzsIknSbTTJ1abXyitOGz4kSRqF4atNawoedpEkSZ1yz4ckSTMgybY0E44VcF5VXd5zSWPDeT4kSRqhJFsm+RjwS+BbNKfa/rK90NyCfqsbD4YPSZJG6zjgocDjaaZTX9D+/8HAsT3WNTYc8yFJ0ggluRrYv6q+O9S+D/C1qtqin8rGh3s+JEkard8w+dkvq4ErOq5lLBk+JEkarbcAhyfZYaIhyfbAO4HDeqtqjHjYRZKkEUpyBs206psCK9vmHWmu7/LTwb5VtXu31Y0HT7WVJGm0Pt93AePOPR+SJKlTjvmQJKljSdJ3DX0yfEiSdBslOTvJM5Jsso5+907yPuD1HZU2ljzsIknSbZRkX+DtwC7A14HTgF8B1wJbA/cD9gb+DDga+NeqmrcXozN8SJI0Ikn2Bp4O7APcA7gdsAo4A1gGfLyq5v1cH4YPSZLUKcd8SJKkThk+JElSpwwfkiSpU4YPSZLUKcOHJEkjkmSjJAcm2a7vWsaZZ7tIkjRCSa4BFlbVxX3XMq7c8yFJ0midCjyo7yLGmVe1lSRptN4LHJ7k7sDpwNWDC6vqR71UNUY87CJJ0ggluWmS5gICVFVt2HFJY8c9H5IkjdbOfRcw7tzzIUmSOuWAU0mSRizJc5KcnOSSJPdo216V5El91zYODB+SJI1QkhcDhwNfAbYCJsZ4/A54VV91jRPDhyRJo/Vy4AVV9VbgxoH204D791PSeDF8SJI0WjsDZ0zSfh2wRce1jCXDhyRJo3Uhk08y9lhgRce1jCVPtZUkabQOB45JshnN3B57JFkMvAE4uNfKxoSn2kqSNGJJngUcCtyzbfolcGhVfaC3osaI4UOSpBmSZHPg9lV1ed+1jBPDhyRJ6pQDTiVJGqEk2yX5WDvB2B+T3Dj403d948ABp5IkjdaHgR2Bw4Bf0VxUTgM87CJJ0ggluQrYp6p+2Hct48rDLpIkjdbPaU6x1VoYPiRJGq1XAW9LslPPdYwtD7tIknQbJbmCNcd2bEEzrvIa4IbBvlV1xw5LG0sOOJUk6bbzarXrwT0fkiSpU475kCRphNr5PLadpP1OzvPRMHxIkjRaazvTZVPg+i4LGVeO+ZAkaQSSvKL9bwEHJ/n9wOINgUcA53Re2BhyzIckSSOQ5ML2v/cAfgEMHmK5HrgIeFNV/aDj0saO4UOSpBFKchLwlKq6ou9axpXhQ5KkGZBkG6Cq6jd91zJuHHAqSdKIJNkqyTFJVgGXAZcnWZXk6CRb9V3fuHDPhyRJI5DkjsApwF2BjwMraM58WQg8k+aaLw/zcIzhQ5KkkUjybmBf4NFVddnQsu2BrwMnVtWSPuobJ4YPSZJGIMlFwAuratlalj8WeH9V7dRlXePIMR+SJI3GDsBPplj+Y2D7jmoZa4YPSZJGYxWw0xTLdwZ+200p483wIUnSaCwD3ppkk+EFSTYFDgO+1nlVY8gxH5IkjUCSuwGnAdcBx3DzVOr3A15Cc22XB1fVz/upcHwYPiRJGpEkOwPvBfbj5gvMFfAN4GVVdX5ftY0Tw4ckSSOWZGvg3u3N86vKsR4DDB+SJKlTDjiVJEmdMnxIkqROGT4kSVKnDB+SJKlThg9JktQpw4cmleSmJE/su45xleQ/kvwmyY1JHtB3PYOSfCjJZ/uuYy5KckiSM/quY5wkeWT7e7DliNZ3j/bz5wED67/ptqw/yUlJDh9FfRoNw8ccluSFSa5MssFA2xZJbkhy4lDfv2h/wXca4fan9Udwtn0wtFemPBD4K5oLSf2434rUsVk5P0GSC5O8YgZWfTKwQ1VdOcJ1Dj/Hs/I5H5bkeUlOS/L7JBcleWXfNfXF8DG3nQRsATx4oG0f4FfAnkPXH3gkcHFVXdRdebPWvYBfVdUPquryqrrptq4wycYjqGtGJdlwkraN+qhF46Oq/lhVl494tVl3l1npL4B/Af6c5jovhyfZp9+S+mH4mMOq6jyaoPGogeZHAZ8HLgT2HGo/aWgVd07y2SRXJzkvyRMmFiTZIMnxSS5Ick2Scwa/VSU5BDgIeFK7R+XGJI8YrjHJh2iCzysH+u2U5KdJXj3U90Ftn53b2zcleVGSr7Q1/CzJU4fuc7ck/5XkiiSrknw+yT2met7a3bw/SHJtkkuS/NvE3qO23qOAHdvtXzDFeh7e7tW5Oslvk3w1yYJ22UlJ3pPkiCS/pr3YVJIlSX7UfjNameSYJFsMrPOg9rHsl+TsJFe1691uku2/KcnlSVYned9gUEjjDQOv3xmDz93Aru7Htt/UrgUePnHYIcnz28d+bZLntM/txkPb/0KSD6/ludk4ydHt8/uHto7XDyxf1/Nwi8MfSV6Z5MKhtucl+XH7Wv4yyVEDyxa07+GJ5+ibGTqEluQfklzaLj8e2Gxoedrn+eftNs5Isv9kj7ntP63nKsmLk5yf5LokK5I8e2DZGoclBh7LTZnkd6xdfhJwD+CI3Px7tnn7uJ4y1Pev2+d9i4FtPT3Jye1rddbgdjLJYZF1vPf3T/Kd3Pw7+aUku6ztORuqbZ01T3H3DZK8Pc3h0l+l+YwaXMda33NJtmx/T/Ybus9T0uxd3qy9PeXnTVU9p6q+VFUXVdUHgCuBu0/nsc85VeXPHP4BTgC+OnD7B8BTaC56dEjbtinwB+A5A/1uAi4G/hbYBXg3zS/KVu3yjYBDgN1pPtQWA1cBT2uXbwH8J/Bl4M7AtsBGk9S3Jc1u2/e3fbalCcVvAM4a6nskcNJQjZcDz6XZG/Fm4AZg14EafwL8B82FnXYFPgasmKyW9j53AX5PEzDuAzyx3cab2uV3AN7YPjd3Bu60lvU8qH1O3wPcH1hIc2GpO7bLTwJWA2+jmYL53m37K2jC2D1oAuHZwNED6z2I5qJVy4Dd2u38BPjYQJ8Pta/VJ9rtHgBcBhw20Oef2vs9muYS4AcC1wD7tMsf2T6/ZwD70lwKfKv2Nb+qfV0fSPMNbjOay4Q/dWD9d27rfMRanp/XABcBD6P58H0Y8PSB5et6Hg4Blg+t85XABQO3X9w+ppe1749FwCsGln8D+Fz7PN4TeEf7Wk+8x/+2fQ3/rn2NDmtfs+UD61gCXAH8Tdvnbe3jvudaHvc6nyvgr9vbL2zrXkLzvn5ku/wewI3AAwbWsaB9vdb2fG8NrAT+kfb3rG0/FvjSUN/PAx8c2NbEZ8GTaX6H/qN9HrYeeK/cCGw5zff+U9p17QI8oN3emQPbn9jmA9ay/ilrXsvjP6l9nf65fa2f065z3/V4z30K+MjQej8FfPjWfN7Q7AH5xcTzON9+ei/Anxl+geFgmj9EG9D84bwO2AZ4Bu0fcuAv21/Euw3c7ybg0IHbm7d99ptiW+8BPjlw+0PAZ6dR40nA4UNt2wPX01wBcuIX+3Lg2UM1Hj10v1Mm2oBnA2cPLd8EuBp49Fpqeesk93kxsHrg9hp/5Nayno8D317HYz59Gs/NU4HLB24f1L4OOw3Vd8nQ8/5rYNOBthdOPIb2Ofg98NChbR0HnND+fyJ8PH6ozyHAtbR/SAbajwH+e+D2q4GfTvG4jgS+sR7v4+HnYTrh4xfAv6xlfQ+n+WO08VD7T4GD2/+fDBw1yftr+dA2Xj/U5wfAe6Z4LFM+V8B3gfcN3ee/aP/gMvTHuW2bMny0fS5kIHy1bQ+h+T3bvr195/b23kPbes3AfTakCTKvGXivDIaDKd/7k9R153Yb95vs8U2y/ilrnuL37VuTvE7/uh7vuSfThK7N2tt3oAm3j25vT/vzBngTcAlw3+k+T3Ptx8Muc99JNHshHgLsDZxXVauAbwEPTTPu41HAz6rqF0P3PWviP1V1Dc033m0n2pK8tN0lf3mSq4C/B3YcRdFVdSnwFeB5bdMTaX6RPz3U9ftDt0+h+aYFzbeqe6c5NHFVW+NvaPb03HMtm75vu45BJwO3T3O57Ol6EHDiOvqcNtyQ5NHt7v9fJLmS5pvTnZLcbqDbNbXm2JxfMfC6tM6squsGbp9C8xjuTvNtenPgG0PPzXNovo1OKOD0Seq+uG55kazjgP2S7NDePogmBK3Nh4Hdkpyb5MgkjxlcOM3nYa2S3JlmL9b/rKXLA2n+ePx26DnYiZufg4XAqUP3+9N7I8kd2m18b6jPydz8HpzMup6rhbdinbdKVf0fzTf8A9um5wAXVdV3h7p+f+A+N9K8d9dWz5Tv/ST3SvKJNIdJVwMX0LzXpvXZsR41D/vR0O01fm+m8Z77Mk0ImjgL8Gk0YWTisU7r8ybJtjTh+cCqOmc6j3kuMnzMcVX1M+CXNAOd/oImdFBVvwJ+TvMN8FHccrwHNLt611gd7XsmyTOAd9J8kD6G5sP8QzQBYVSOB56RZFOaXd//VVXXTuN+1f57e5oPyQe09U383IfmkMRkwi1H1g9eFnu6/jCNPlevsZHm2PCXgB/S7JreHXhpu3hwjMBkr8t0B+gVzfMCzdk6g8/L/WgOH6y1xrW1VdUPaT7cD0yye7uuj6y1iKozaP7Qv5HmUMQnk3wSpv083MQtH/Pgc7Su5//2NN88h98buwL/PljqOtYzWZ/J3kM3d57eczXVOm8aaJtwWwYsH09z6BKaIPTBad5vbY9xXc/9f9McBjoY2KP9Cev32XFrap7q82yd77mquoHmy88z2/bFwH9WuyuD6X/ebN/+e940ap6zDB/zw0k0weNRwP8OtH+bZjzAHkwePqbyMODkqjq2qs6sqgu45d6E62l20a7L2vp9heYP3UuAxwIfmKTPnpPcnvg2sZzmOPyvq+qCoZ+r1lLL2TSPbdDDgauq6pfrfih/8iOasRLrYxGwQVW9pqpOrarzgbuu5zomPLANbRP2An7f7t06m+bw2z0meV7W5zEOO55mT9VzgW+ua11V9fuq+lRVvRB4OvDUJFsxvefh19z8IT5ht8F104wpWdtrsLy9/42TPAcTe3VWMPn7a2IbV9EEmL2H+jysve9UpnquVqxjnb9u/91hYPlurDsore337ASaAdQvpwlCH52kz58ed5qznhax9se41vd+kjvS/DF+S1WdVFXnAndaR92TmU7N62O6v3sfBx6b5H40n6knDCyb7ufNeTR7oi+5jTXPbn0f9/Fn5n9o9hpcTfMH584D7c+h2W14I+3x04FlNwFPHGq7gmZXIcDL29v70fzCvRn4HWseD38DzXHm+9B8wKxtkOexNLt179H2y8Cyt9CMMfjJJPe7iWYg5XPbGv6F5tvNfdvlt6MJIifSfJjv9P/bOXsQK64wDD9TaGO0EosNrIQQ3ErRJhBYghFblRRClDUWJhjiXyxWG20kqIUQSYIGBBFsbBKwEAwiiBhiY4oERBZR/CUsLrhIdgvdsXi/8Z6dO/cnKeaO4X3gFvecMzNnznznO9+c855BAdhJYKhDXYbQ8tL36C14I9KaHErK9KP5+AC9Af6IRHcjwE7mC07LOpeV8Sz2IIHnGJqdSte7PwemSsdtRINo8f9sPNfztASnT5HDL8ocifvahpYZViNh5ljkF5qPJaVrtWktkrzFSEsyQwiPu7TPPhRwrAj7OAM8/hftMAK8BMaj/l+jKe5U87EN2f1utNS0BtiV5F9DA8b6sL2Pwt7WRP7mOH57Yl9lwele1A82x30cQ/ZaKTjtp63iec7SEpzuR4HDaFLmt7ChkXhWv0f7dNN8XEYC2yFKQumwlVkSLUqkF/qLe7QEpz9FOxS2PM9W6GL7aIZjEs30vI/0Zjej7htK11xZdf5ede5w71X97RdawtqeNpcc9wAJse+U0vvyNyjwuI2+jTLw8WFQv4FXwL8aHnJLHf9XKX040qsG9jfOIEmbohV8LEQzEVPI6f+AxJqpY16KtpBOd3OM4axuIEf/ChhO8t4Lx7O/4ri5cGqXkfDrLskugiizDA3Gf0eZCbSz5p0u7TWKnPkMWrL6Fr0VFfk9g4/kPNfjus/QTE7hoK+WnWFy7kdoYLoEbOW/BR8/o0BhEg0Up2gXV+5CsyCzQKGxKYSGH3dwvB2Dj8g/F9dc0KNtdqCBfxoN3r8Cq/pthyjzJZrdmI57Plh+LsAXyT0+Ar5L8hahXVwPI/8+eoN+NylzMGznOZraP8p8G8/Q0tGDOMctYH2f/bJjW6HAYyLOeRvYUsofQX3mBdLlrKN38PEhGjRnUnuJvLWoP31a4TvmUKBY9Ik/0+tU2Qrdbf8T9GG+f6I+o7QHH29283Sxxco6d7j3tv5GEnz0a3NR7nikH664Tk9/k9zPcK96/59/WTSGMY0k0wd4rqCdOJOlvDlgU57nFwdSOdNGlmVX0BbpbwZdl6bTpLbKsmwMOIHe0F8m6cuRIHR1nudlweZA6VRn83bgrxOaRhK7cApV+IVy4GGaRWg11qK3uq8GXJ1G06S2ip0cQ8AB4HSHQbxRXxvts86m4VhwaprKZ2gafAlyMlV42q45/IGWJcbzPJ8YdGUaTpPaahwt6zxBepUqmtbP+qmzaThedjHGGGNMrXjmwxhjjDG14uDDGGOMMbXi4MMYY4wxteLgwxhjjDG14uDDGGOMMbXi4MMYY4wxteLgwxhjjDG14uDDGGOMMbXi4MMYY4wxtfIaWiU+W0YcugoAAAAASUVORK5CYII=" />
</div>
<h2 id="aggregatingwithmultiplecolumns">
Aggregating with multiple columns
</h2> We can call
<code>groupby</code> with multiple columns as input to get more granular groups. If we use the <code>What type of cranberry saucedo you typically have?</code> and <code>What is typically the main dish at your Thanksgiving dinner?</code> columns as input, we'll be able to find the average income of people who eat <code>Homemade</code> cranberry sauce and <code>Tofurkey</code>, for example: grouped = data.groupby(["What type of cranberry sauce do you typically have?", "What is typically the main dish at your Thanksgiving dinner?"])
grouped.agg(np.mean)<div class="output_html rendered_html output_subarea output_execute_result">
<div>
<table border="1" class="dataframe table table-bordered">
<thead>
<tr style="text-align: right;">
<th>
</th>
<th>
</th>
<th>
RespondentID
</th>
<th>
gender
</th>
<th>
income
</th>
</tr>
<tr>
<th>
What type of cranberry sauce do you typically have?
</th>
<th>
What is typically the main dish at your Thanksgiving dinner?
</th>
<th>
</th>
<th>
</th>
<th>
</th>
</tr>
</thead>
<tbody>
<tr>
<th rowspan="7" valign="top">
Canned
</th>
<th>
Chicken
</th>
<td>
4336354418
</td>
<td>
0.333333
</td>
<td>
80999.600000
</td>
</tr>
<tr>
<th>
Ham/Pork
</th>
<td>
4336757434
</td>
<td>
0.642857
</td>
<td>
77499.535714
</td>
</tr>
<tr>
<th>
I don't know
</th>
<td>
4335987430
</td>
<td>
0.000000
</td>
<td>
4999.500000
</td>
</tr>
<tr>
<th>
Other (please specify)
</th>
<td>
4336682072
</td>
<td>
1.000000
</td>
<td>
53213.785714
</td>
</tr>
<tr>
<th>
Roast beef
</th>
<td>
4336254414
</td>
<td>
0.571429
</td>
<td>
25499.500000
</td>
</tr>
<tr>
<th>
Tofurkey
</th>
<td>
4337156546
</td>
<td>
0.714286
</td>
<td>
100713.857143
</td>
</tr>
<tr>
<th>
Turkey
</th>
<td>
4336705225
</td>
<td>
0.544444
</td>
<td>
85242.682045
</td>
</tr>
<tr>
<th rowspan="8" valign="top">
Homemade
</th>
<th>
Chicken
</th>
<td>
4336539693
</td>
<td>
0.750000
</td>
<td>
19999.500000
</td>
</tr>
<tr>
<th>
Ham/Pork
</th>
<td>
4337252861
</td>
<td>
0.250000
</td>
<td>
96874.625000
</td>
</tr>
<tr>
<th>
I don't know
</th>
<td>
4336083561
</td>
<td>
1.000000
</td>
<td>
NaN
</td>
</tr>
<tr>
<th>
Other (please specify)
</th>
<td>
4336863306
</td>
<td>
0.600000
</td>
<td>
55356.642857
</td>
</tr>
<tr>
<th>
Roast beef
</th>
<td>
4336173790
</td>
<td>
0.000000
</td>
<td>
33749.500000
</td>
</tr>
<tr>
<th>
Tofurkey
</th>
<td>
4336789676
</td>
<td>
0.666667
</td>
<td>
57916.166667
</td>
</tr>
<tr>
<th>
Turducken
</th>
<td>
4337475308
</td>
<td>
0.500000
</td>
<td>
200000.000000
</td>
</tr>
<tr>
<th>
Turkey
</th>
<td>
4336790802
</td>
<td>
0.531008
</td>
<td>
97690.147982
</td>
</tr>
<tr>
<th rowspan="8" valign="top">
None
</th>
<th>
Chicken
</th>
<td>
4336150656
</td>
<td>
0.500000
</td>
<td>
11249.500000
</td>
</tr>
<tr>
<th>
Ham/Pork
</th>
<td>
4336679896
</td>
<td>
0.444444
</td>
<td>
61249.500000
</td>
</tr>
<tr>
<th>
I don't know
</th>
<td>
4336412261
</td>
<td>
0.500000
</td>
<td>
33749.500000
</td>
</tr>
<tr>
<th>
Other (please specify)
</th>
<td>
4336687790
</td>
<td>
0.600000
</td>
<td>
119106.678571
</td>
</tr>
<tr>
<th>
Roast beef
</th>
<td>
4337423740
</td>
<td>
0.000000
</td>
<td>
162499.500000
</td>
</tr>
<tr>
<th>
Tofurkey
</th>
<td>
4336950068
</td>
<td>
0.500000
</td>
<td>
112499.500000
</td>
</tr>
<tr>
<th>
Turducken
</th>
<td>
4336738591
</td>
<td>
0.000000
</td>
<td>
NaN
</td>
</tr>
<tr>
<th>
Turkey
</th>
<td>
4336784218
</td>
<td>
0.523364
</td>
<td>
74606.275281
</td>
</tr>
<tr>
<th rowspan="4" valign="top">
Other (please specify)
</th>
<th>
Ham/Pork
</th>
<td>
4336465104
</td>
<td>
1.000000
</td>
<td>
87499.500000
</td>
</tr>
<tr>
<th>
Other (please specify)
</th>
<td>
4337335395
</td>
<td>
0.000000
</td>
<td>
124999.666667
</td>
</tr>
<tr>
<th>
Tofurkey
</th>
<td>
4336121663
</td>
<td>
1.000000
</td>
<td>
37499.500000
</td>
</tr>
<tr>
<th>
Turkey
</th>
<td>
4336724418
</td>
<td>
0.700000
</td>
<td>
82916.194444
</td>
</tr>
</tbody>
</table>
</div>
</div> As you can see above, we get a nice table that shows us the mean of each column for each group. This enables us to find some interesting patterns, such as:
<ul>
<li>
People who have <code>Turducken</code> and <code>Homemade</code> cranberry sauce seem to have high household incomes.
</li>
<li>
People who eat <code>Canned</code> cranberry sauce tend to have lower incomes, but those who also have <code>Roast Beef</code> have the lowest incomes.
</li>
<li>
It looks like there's one person who has <code>Canned</code> cranberry sauce and doesn't know what type of main dish he's having.
</li>
</ul>
<h2 id="aggregatingwithmultiplefunctions">
Aggregating with multiple functions
</h2> We can also perform aggregation with multiple functions. This enables us to calculate the mean and standard deviation of a group, for example. In the below code, we find the sum, standard deviation, and mean of each group in the
<code>income</code> column: grouped["income"].agg([np.mean, np.sum, np.std]).head(10)<div class="output_html rendered_html output_subarea output_execute_result">
<div>
<table border="1" class="dataframe table table-bordered">
<thead>
<tr style="text-align: right;">
<th>
</th>
<th>
</th>
<th>
mean
</th>
<th>
sum
</th>
<th>
std
</th>
</tr>
<tr>
<th>
What type of cranberry sauce do you typically have?
</th>
<th>
What is typically the main dish at your Thanksgiving dinner?
</th>
<th>
</th>
<th>
</th>
<th>
</th>
</tr>
</thead>
<tbody>
<tr>
<th rowspan="7" valign="top">
Canned
</th>
<th>
Chicken
</th>
<td>
80999.600000
</td>
<td>
404998.0
</td>
<td>
75779.481062
</td>
</tr>
<tr>
<th>
Ham/Pork
</th>
<td>
77499.535714
</td>
<td>
1084993.5
</td>
<td>
56645.063944
</td>
</tr>
<tr>
<th>
I don't know
</th>
<td>
4999.500000
</td>
<td>
4999.5
</td>
<td>
NaN
</td>
</tr>
<tr>
<th>
Other (please specify)
</th>
<td>
53213.785714
</td>
<td>
372496.5
</td>
<td>
29780.946290
</td>
</tr>
<tr>
<th>
Roast beef
</th>
<td>
25499.500000
</td>
<td>
127497.5
</td>
<td>
24584.039538
</td>
</tr>
<tr>
<th>
Tofurkey
</th>
<td>
100713.857143
</td>
<td>
704997.0
</td>
<td>
61351.484439
</td>
</tr>
<tr>
<th>
Turkey
</th>
<td>
85242.682045
</td>
<td>
34182315.5
</td>
<td>
55687.436102
</td>
</tr>
<tr>
<th rowspan="3" valign="top">
Homemade
</th>
<th>
Chicken
</th>
<td>
19999.500000
</td>
<td>
59998.5
</td>
<td>
16393.596311
</td>
</tr>
<tr>
<th>
Ham/Pork
</th>
<td>
96874.625000
</td>
<td>
387498.5
</td>
<td>
77308.452805
</td>
</tr>
<tr>
<th>
I don't know
</th>
<td>
NaN
</td>
<td>
NaN
</td>
<td>
NaN
</td>
</tr>
</tbody>
</table>
</div>
</div>
<h2 id="usingapplyongroups">
Using apply on groups
</h2> One of the limitations of aggregation is that each function has to return a single number. While we can perform computations like finding the mean, we can't for example, call
<code>value_counts</code> to get the exact count of a category. We can do this using the <a href="https://pandas.pydata.org/pandas-docs/version/0.18.1/generated/pandas.core.groupby.GroupBy.apply.html">pandas.GroupBy.apply</a> method. This method will apply a function to each group, then combine the results. In the below code, we'll apply <code>value_counts</code> to find the number of people who live in each area type (<code>Rural</code>, <code>Suburban</code>, etc) who eat different kinds of main dishes for Thanksgiving: grouped = data.groupby("How would you describe where you live?")["What is typically the main dish at your Thanksgiving dinner?"]
grouped.apply(lambda x:x.value_counts())How would you describe where you live? How would you describe where you live?
Rural Turkey 189
Other (please specify) 9
Ham/Pork 7
I don't know 3
Tofurkey 3
Turducken 2
Chicken 2
Roast beef 1
Suburban Turkey 449
Ham/Pork 17
Other (please specify) 13
Tofurkey 9
Roast beef 3
Chicken 3
Turducken 1
I don't know 1
Urban Turkey 198
Other (please specify) 13
Tofurkey 8
Chicken 7
Roast beef 6
Ham/Pork 4
Name: What is typically the main dish at your Thanksgiving dinner?, dtype: int64The above table shows us that people who live in different types of areas eat different Thanksgiving main dishes at about the same rate.
<h2 id="freepandascheatsheet">
  Free Pandas Cheat Sheet
</h2> If you're interested in learning more about pandas, check out our interactive course on

<a href="/course/python-for-data-science-intermediate/">NumPy and pandas</a>. You can register and do the first lessons for free. You also might like to take your pandas skills to the next level with our <a href="https://s3.amazonaws.com/dq-blog-files/pandas-cheat-sheet.pdf">free pandas cheat sheet!</a> <h2 id="furtherreading">
  Further reading
</h2> In this tutorial, we learned how to use pandas to group data, and calculate results. We learned several techniques for manipulating groups and finding patterns. In the next tutorial, we'll dive more into combining and filtering DataFrames. If you want to learn more about pandas and the material covered in this tutorial, here are some resources:

<ul>
  <li>
    <a href="https://pandas.pydata.org/pandas-docs/stable/groupby.html">Split-Apply-Combine with pandas</a>
  </li>
  <li>
    <a href="https://pandas.pydata.org/pandas-docs/stable/10min.html">10 minutes to pandas</a>
  </li>
  <li>
    <a href="http://www.gregreda.com/2013/10/26/working-with-pandas-dataframes/">Working with pandas DataFrames</a>
  </li>
</ul>