How to Use Dataquest
Dataquest’s learning platform is user-friendly enough that if you’d like to, you can simply dive right in. But if you’re the type who likes to flip through the user manual first, this article is for you!
In it, we’re going to cover the basic features of the Dataquest platform, and pass along some helpful tips and tricks to make your learning more efficient along the way!
Dataquest Basics: Paths, Parts, Courses, and Lessons
Dataquest’s learning content is broken into (in order of largest to smallest) paths, parts, courses, lessons (and guided projects), and screens.

Paths are the specific course sequences that are organized around specific job titles and coding languages, like Data Scientist in Python or Data Analyst in R.
You can switch between paths at any time, and you do not have to complete prior courses before starting courses later in the path. We do recommend you try to work through the paths in order, though.
Paths are broken up into parts, which are smaller sequences of courses that focus on a specific skillset. The first part in the Data Scientist path in Python path, for example, consists of two courses that cover the fundamentals of programming in Python for Data Science and several guided projects that challenge you to apply and expand on those skills.
Once you’ve completed a part, you move on to the courses in the next part, which will focus on helping you build a different skillset, so that by the end of the path, you’ve completed multiple parts, each of which helped you develop important new skills while building on what you learned previously.
Parts are broken up into courses, and you can typically expect 2-5 courses in each part. Each course focuses on a smaller specific topic. For example, in the second part of the Data Scientist path, the first course is focused on covering how to use the pandas and numpy libraries for data science tasks.
Within each course are several lessons, smaller units of learning that focus on subtopics of the course topic. In the aforementioned course on pandas and numpy, for example, there is a lesson that introduces pandas, a lesson that covers exploring data with pandas, a lesson that introduces numpy, etc. Lessons break the courses up into digestible chunks. For many students, it should be possible to complete a lesson within a single study session.
Guided projects typically come at the end of each course, and their aim is to get you to apply the new skills you’ve learned as you moved through the course’s lessons. Guided projects vary in length and complexity, and are relatively open-ended to encourage you to apply your skills and creativity.
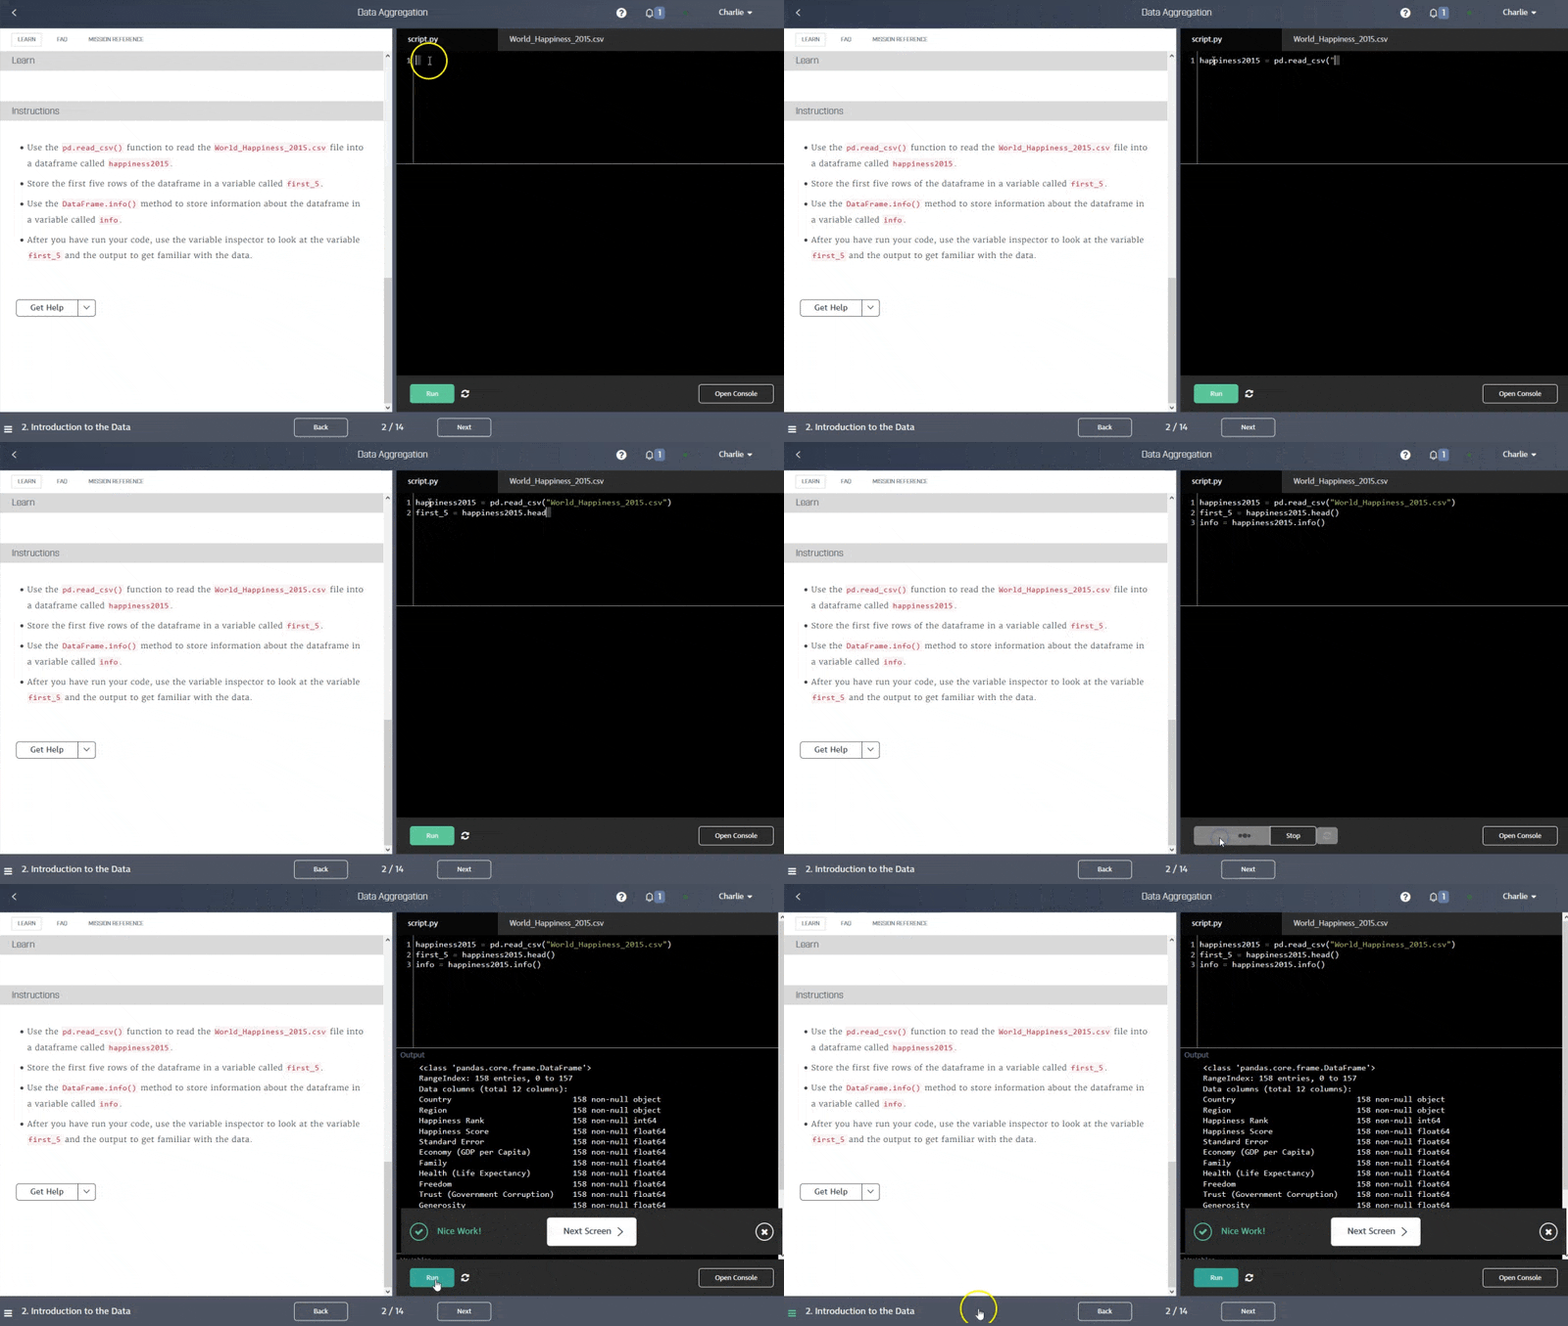
Finally, screens are the smallest units of learning on Dataquest, and each lesson or guided project is broken up into a series of screens. Typically, a screen presents a new concept on the left side of the screen, and then challenges you to apply what they just learned by writing code on the right side of the screen. This code is then checked against the correct answer, so you get immediate feedback on whether or not you’ve grasped the concept.
You can always find all of Dataquest’s courses listed in the directory, and clicking on any path or course will take you to a page with details about what it contains.
The Dashboard: Your Learning Hub
The Dashboard is your home base on Dataquest, and it’s the best place to track and measure your Dataquest progress. When you log in to Dataquest, it will be the first screen you see, but as long as you’re logged in, you can always access it at app.dataquest.io/dashboard as well.
The first thing you’ll see in the Dashboard is a prompt to start wherever you last left off in your studies. Below that is a progress tracker that shows what percent of your chosen path you have completed (the green bar above your selected path). This section also shows you how much time you’ve spent on the site in the past month, and how many lessons and projects you have completed.
Note: since we’re always adding new courses, you may occasionally see your completion rate drop slightly because we have added a new course to your path.
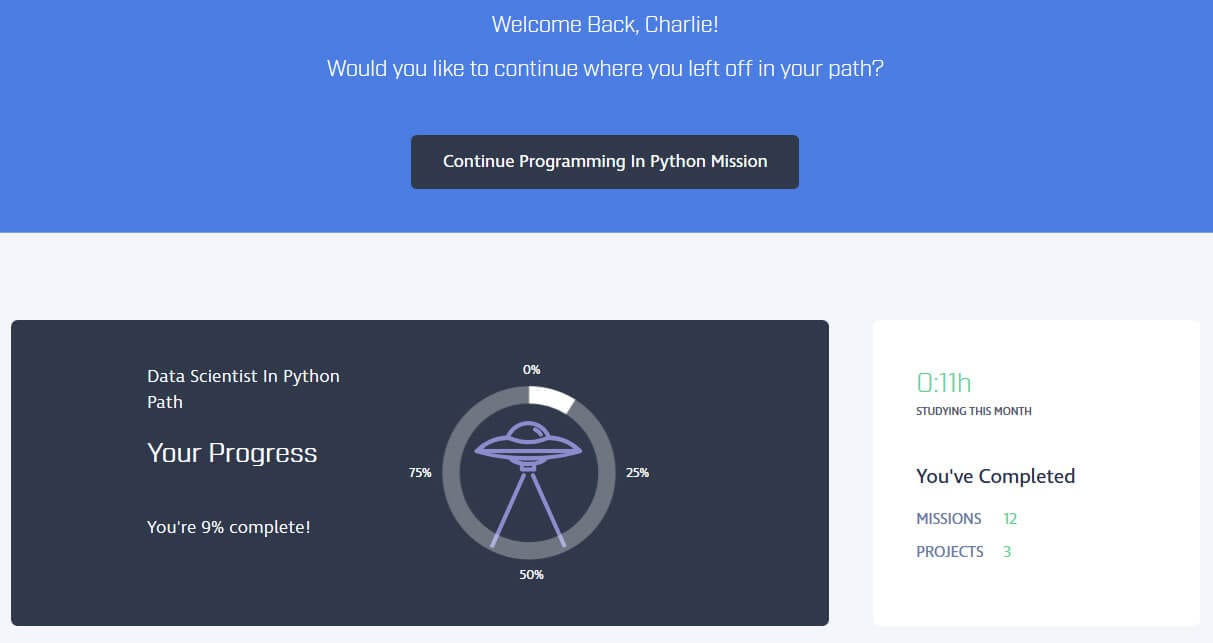
You can change the path you're on at any time by clicking the Pencil icon next to "current path." Your progress will be saved no matter which path you select, so feel free to switch back and forth!
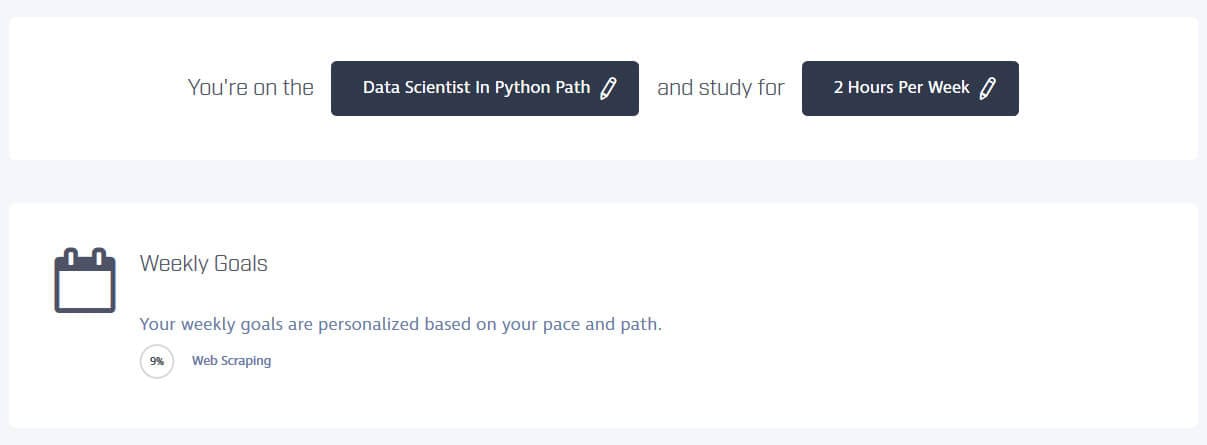
Below this section you’ll see your study schedule, and a weekly agenda based on your planned schedule and path progress. This is used to set weekly study goals for you. You can change the number of hours you're planning to study at any time by clicking the Pencil icon and your agenda will adjust itself accordingly.
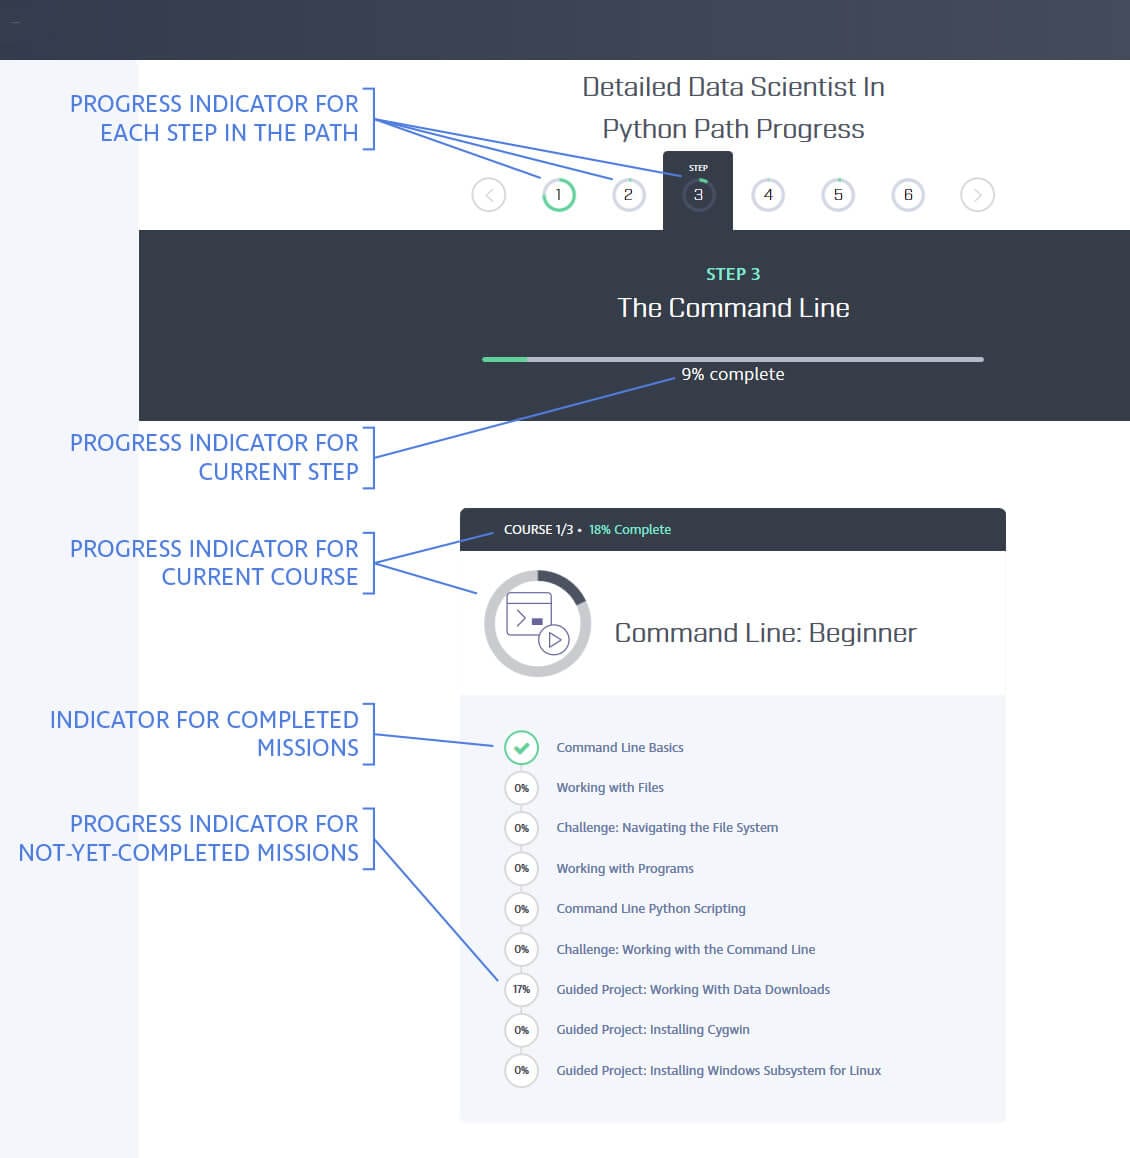
Below this, you’ll see a more detailed visualization of your progress in the context of each part of the path. In the image below, for example, you can see that the student has completed Part 1 of this path, and is currently working in the Exploratory Data Visualization course, which is the second course in Part 2.
The Learning Interface
When you enter any Dataquest course, you may see an introductory text screen, but you’ll move quickly from there to a dual-window screen like the one pictured below.
This screen layout is the foundation of the Dataquest learning experience, and it allows you to read about a new concept in the left window and then immediately experiment and apply what you’ve learned in the right window.
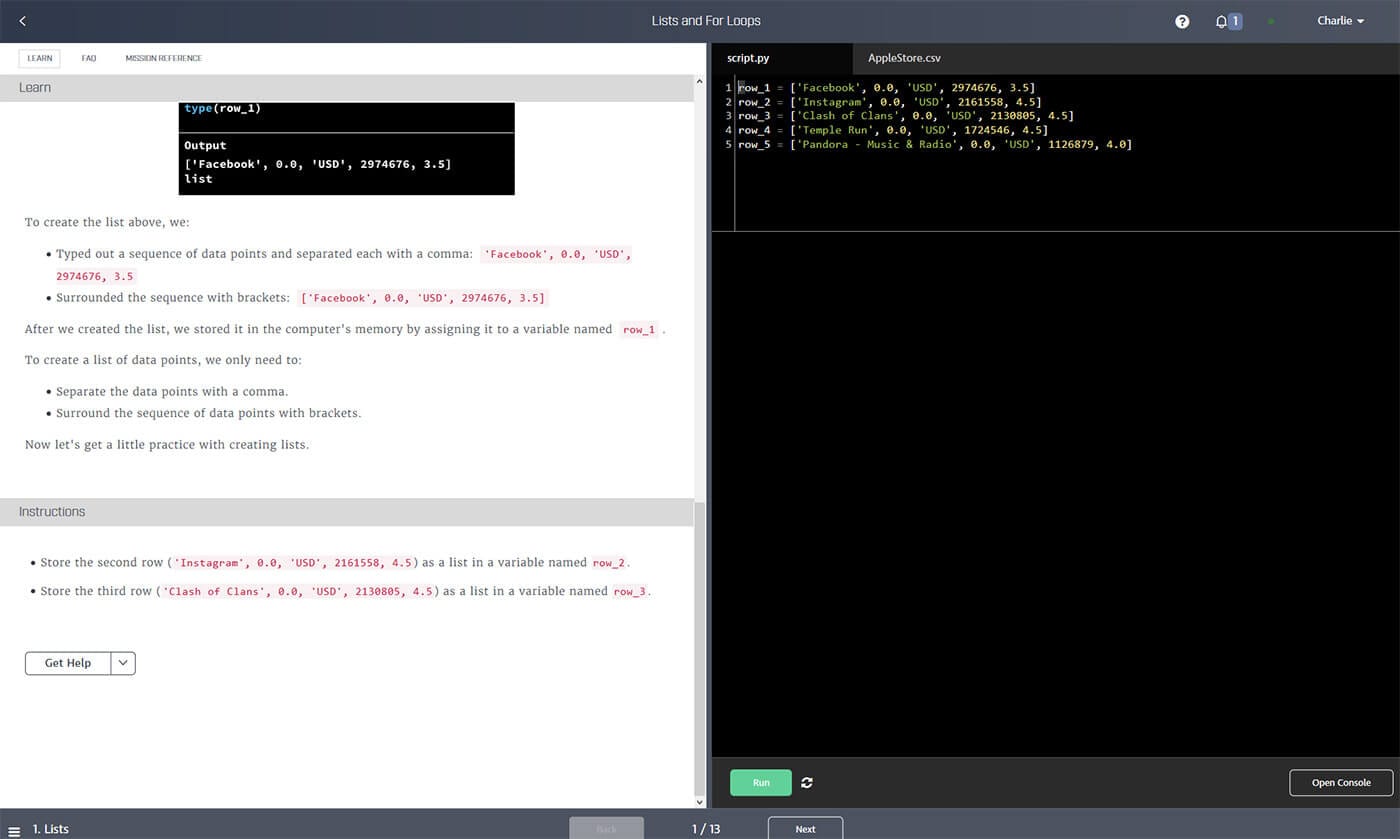
There’s a lot of functionality packed into this screen, so let’s take a closer look.
The Learning Interface: Top Bar

Along the top of the screen, you’ll see a gray menu bar. From left to right, this contains:
- A Dashboard button that will return you to your dashboard
- The title of the lesson you’re currently working on
- A page icon that indicates the status of your virtual code-runner. If this is a green checkmark, you're good to run code! You can click on this icon for more details about your connection and virtual machine status.
- A ? button that will help you resolve issues and connect you with our support team
- A bell icon that will display any notifications you have from the platform
- An account icon. Clicking on this will open a menu that links you to important pages like your Dashboard, your account page, your current Dataquest plan, your Dataquest profile, etc.
The Learning Interface: Left Window
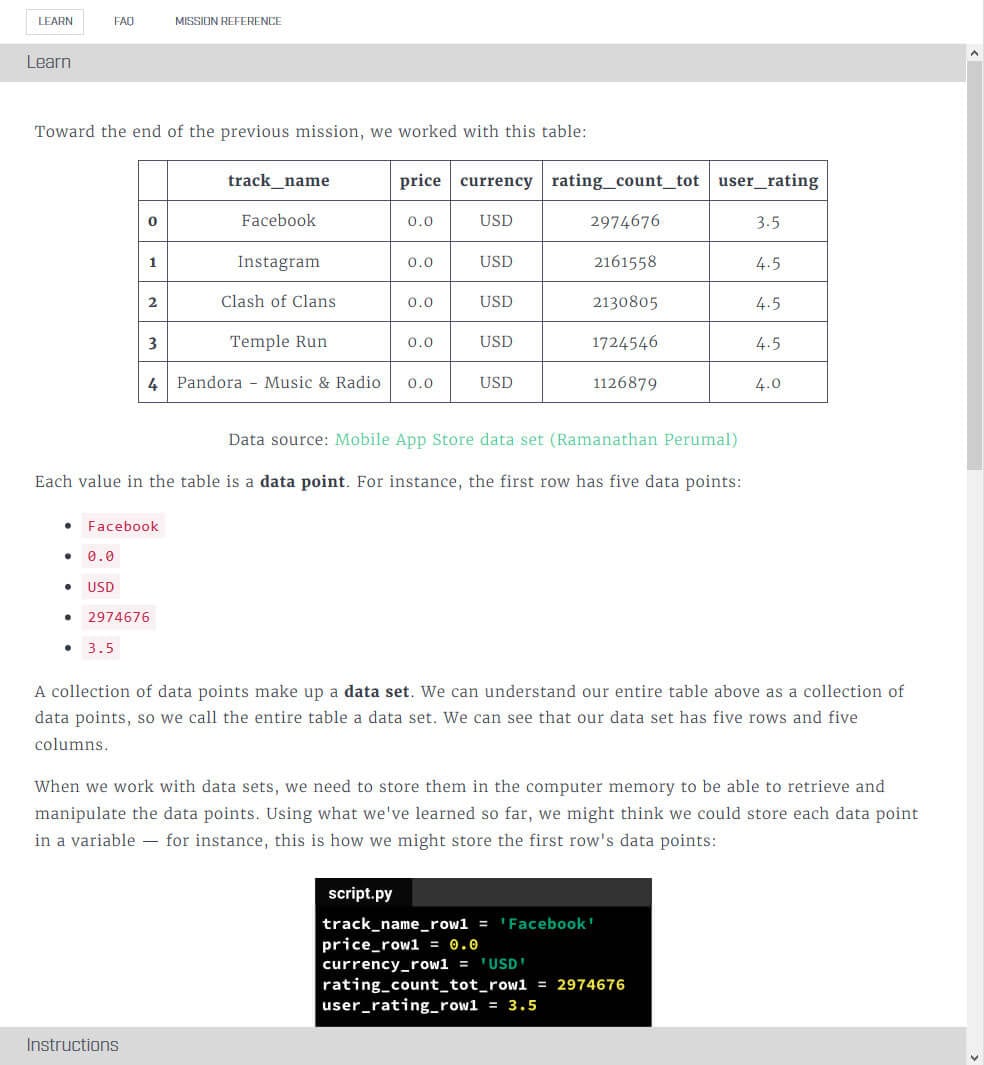
At the top of the left window, you’ll notice two tabs: Learn and Lesson Reference.
By default, this window will display the Learn tab, and this is where you’ll be presented with new concepts. In the Learn tab, you’ll read through a simple explanation of a new concept, often including code examples and diagrams. As you reach the end of this explanation, you’ll scroll to a section of the tab called Instructions that will explain what you need to do in the coding window to the right to complete the screen.
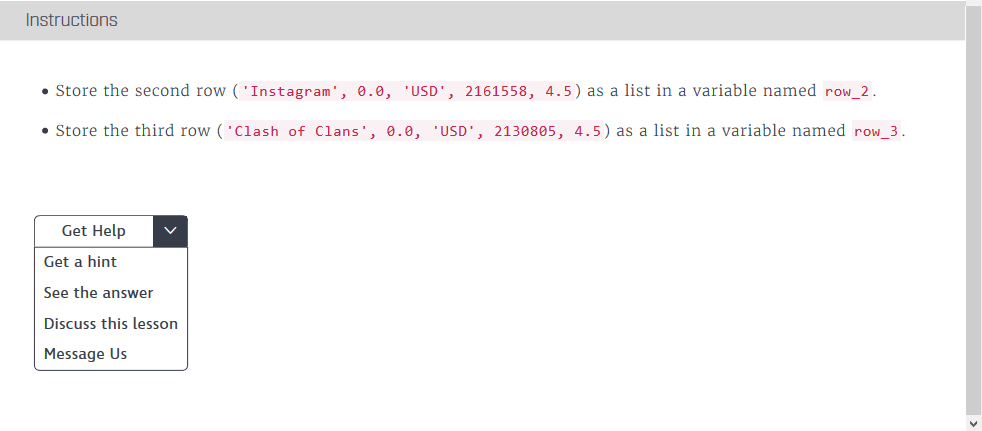
If you run into trouble, you can scroll further down and click the “Get Help” button to see a customized hint, see the correct answer, or contact support.
The Lesson Reference tab opens a search bar that allows you to quickly search for information from lessons and screens you’ve already completed. If you’ve forgotten how to do something you learned previously and need a quick refresher, you can find the relevant content and review it quickly and easily in the Lesson Reference tab.
The Learning Interface: Right Window
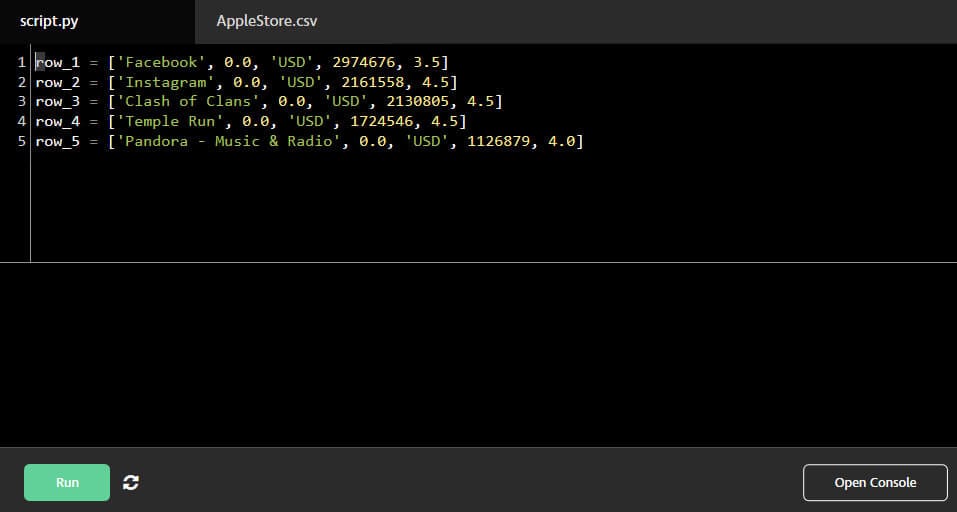
The right side of the screen is where you write your code to complete the instructions outlined on the left side of the screen.
There are generally two tabs here. The default tab will be a scripting tab called usually called script.py or script.r, and that’s where you write your code. But there’s often a second tab, which will be named after the data set you’re working with. Clicking on this tab displays the header row and the first five entries of your data set in a table format, so you can easily reference what your data looks like.
In the scripting tab, you’ll often see a little bit of code written for you when you open each new screen. Code you’ve written in previous screens will be saved so that you can see what you did whenever you look back at that screen. Although it’s not required, it can be a good idea to add comments to your code as you write it, so that when you look back you can read your own explanations of what your code is doing.
As you write code, you’ll note that your text changes color based on what you’ve written. This is called syntax highlighting, and it helps you differentiate between different syntax elements within your code. You’ll also notice that this window automatically indents code based on what you’ve written, and that you’ll be prompted to autocomplete things like variable names rather than having to type them out. These time-saving features make writing code more efficient.
Note, also, that once you’ve defined a variable in one screen, that variable is stored for the rest of the lesson, so you don’t have to keep re-defining it on each new screen you come to. So, for example, if you create a list of lists variable called my_dataset in the first screen, you’ll be able to write a for loop in the second screen that loops through my_dataset without having to reproduce all your my_dataset code in the second screen.
At the bottom of the right window, you’ll see four buttons. From left to right, these are: Run Code, Submit Answer, Reset Code, and Open Console.
The Run Code button does exactly what you’d expect: run your code. You can use this button to run code snippets and experiment before you're ready to submit your answer.
The Submit Answer button runs your code and submits it as your answer to be checked by our answer-checking system. There are three possible results of clicking this button:
- Your code works and is correct. In this case, you’ll hear a cheery “ping” sound and see a prompt to move on to the next screen.
- Your code works but is incorrect. In this case, you’ve written working code, but it didn’t produce the answers we were expecting, and you’ll get an error display that will show which variables or elements differ from what the answer-checker expects.
- Your code doesn’t work. You may have a syntax error or there’s some other problem with the way you’ve written your code, and you’ll see an error message based on the coding language you’re using.
The Reset Code button will reset the code on this screen to its default state — whatever was displayed when you opened this screen for the first time.
The Open Console button opens a small sub-window in which you can type and run small snippets of code without affecting the script you’re writing above. This can be useful for experimentation.
The Learning Interface: Bottom Bar

Along the bottom of the screen, you’ll see another gray bar. On the left hand side, you’ll see the name of the current screen you’re working on, and a sandwich menu button, If you click this, it opens a menu with links and the names for each screen in your current lesson.
Further right along the bar, you’ll see a counter that indicates your current screen number and the total number of screens in the lesson (i.e., 1/10 means you’re on screen 1 out of 10 total screens for that lesson). On either side of this counter are Back and Next buttons that will take you to the previous screen or the next screen (respectively) if clicked.
Keyboard Shortcuts
We’ve introduced all the visual features of our learning platform, but if you want to work at maximum efficiency, you don’t need to use the buttons. You can also navigate the platform quickly using keyboard shortcuts. Shortcuts can be viewed by holding the mouse over each button:

Here’s a table of all of the available keyboard shortcuts for easy reference. You can also access this information in our Knowledge Base.
| Windows/Linux | Mac | |
|---|---|---|
| Run your code | Shift + Enter | Shift + Enter |
| Submit answer | Alt + Enter | Option + Enter |
| Next screen | Alt + n | Option + n |
| Previous screen | Alt + b | Option + b |
| Restore to initial code | Alt + r | Option + r |
| Convert code to comment | Ctrl + / | Option + / |
Here's what the code conversion shortcut looks like in practice. If you enter the shortcut with your cursor in a single line, that line will be commented out. If you highlight multiple lines with the cursor, all the lines will be commented out when you enter the shortcut.

You can also use this shortcut to quickly convert comments back into code.
Customizing the Learning Interface
If you'd like to customize your experience on Dataquest, there are a couple of things you can do. First, the central bar between the left and right windows can be dragged to resize these windows, giving you more room to read or more room to code depending on your preference.
You can also switch between the default "light mode" and a "dark mode" for both the left and right windows of the interface. This setting is accessible within the "settings" area of your account page, under text theme and editor theme for the left and right windows, respectively. (By default, your text theme is set to light and your editor theme is set to dark).

The Learning Interface: Other Situations
Although most of our courses make use of the interface described above, there are some courses that are a little different. The Command Line courses, for example, make use of a virtual command line environment on the right side of the screen (rather than a Python or R coding environment). And some courses and projects will use an embedded version of Jupyter Notebooks.
When you encounter these alternative interfaces, the course instructions will explain how to use them. But with Jupyter Notebooks in particular, there are a few complications you’ll want to watch out for.
The first is dealing with connectivity issues, so if you encounter any connection problems, consult our support articles about troubleshooting connection issues or Jupyter Notebook kernel issues.
The second is that your code won’t automatically be stored forever if you’re using the Jupyter Notebooks embed on our site. If you want to keep it long-term, you should click on the “Download” button along the top bar to download your notebook. That said, we recommend that you install Anaconda so that you can get used to working with Jupyter Notebooks locally, which will make it easier for you to take on projects outside of Dataquest’s site.
![]()
Note also that clicking the key button in this top bar will allow you to access and download the solutions file, in case you need help or just wish to save it for future reference.
Takeaways
While most screens in each lesson use the Learning Interface laid out above, the final screen of each lesson will present you with a downloadable PDF we call a Takeaway. Each lesson’s takeaway summarizes the big concepts you learned over the course of the lesson and provides examples of their usage and syntax.
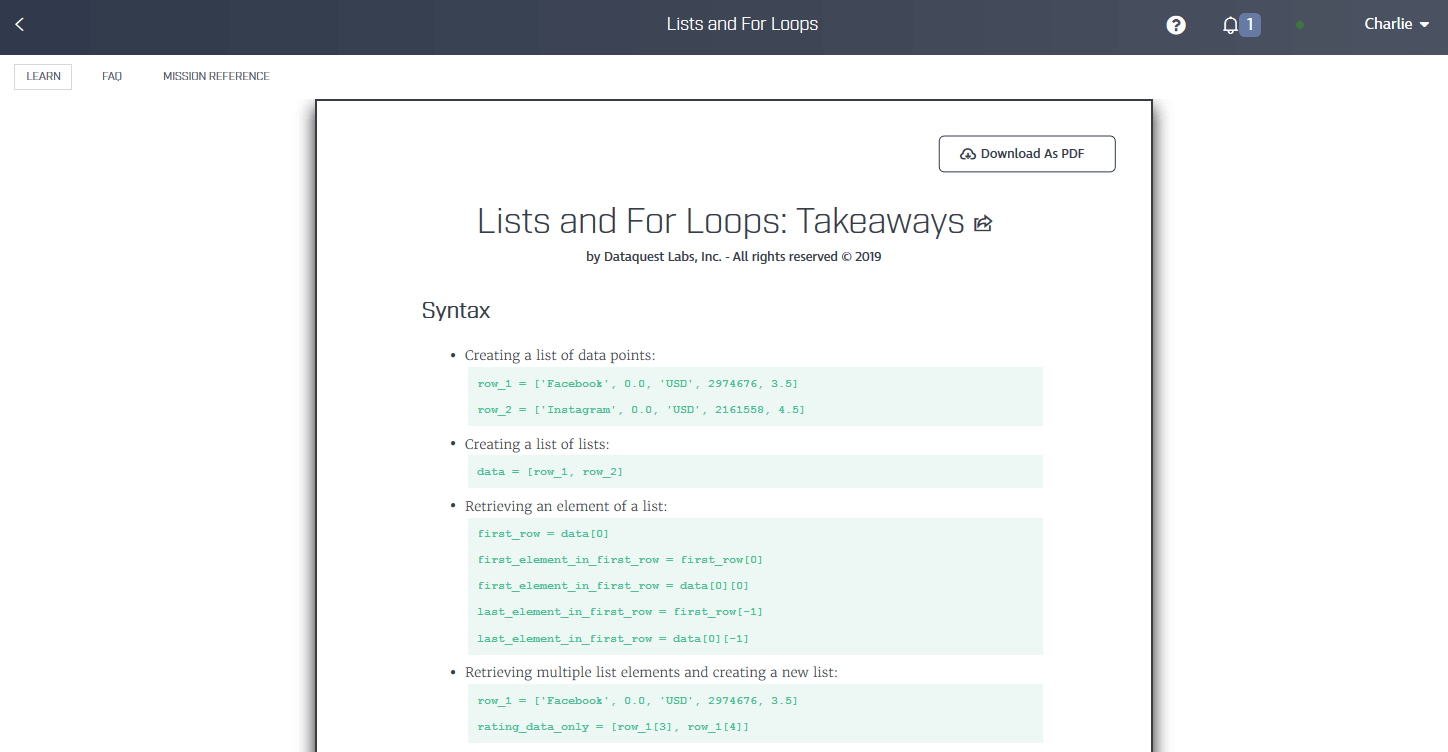
These takeaways are designed to be quick and easy references. You can refer to them any time you’re writing code (on Dataquest or elsewhere) to get a refresher on what you’ve learned. They’re also useful as quick study guides or review tools. If, for example, you load them onto your mobile device, you can flip through them and get in a little bit of data science study from anywhere.
Tips and Tricks
The Dataquest platform is pretty straightforward, but here are a few of the key tips and tricks that’ll help make your time on Dataquest more effective and efficient:
- Don’t forget about hints, answers, and the FAQ. Support is there to help if you really need it, but a lot of times you’ll be able to resolve your own problems using these resources.
- Keyboard shortcuts are fun. It only takes a few seconds to learn them, and they’ll speed up your navigation of Dataquest.
- Comment your code. Although it’s not required in most lessons, it’s good practice and it can help you in the future. Since the code you write for each screen is saved and stored on that screen, if you’ve commented it, you can look back and see your own explanations of what your code is doing.
- Download the Takeaways. They’re really helpful for quick reference, and you can load them onto a mobile device and flip through them like notecards to get some studying in when you’re on the go.