Project Tutorial: Analyzing Startup Fundraising Deals from Crunchbase
In this project walkthrough, we'll explore how to work with large datasets efficiently by analyzing startup investment data from Crunchbase. By optimizing memory usage and leveraging SQLite, we'll uncover insights about fundraising trends while learning techniques that scale to real-world data challenges.
Working with large datasets is a common challenge in data analysis. When your dataset exceeds your computer's memory capacity, you need smart strategies to process and analyze the data effectively. This project demonstrates practical techniques for handling medium-to-large datasets that every data professional should know.
Throughout this tutorial, we'll work within a self-imposed constraint of 10MB of memory—a teaching device that simulates the challenges you'll face with truly massive datasets. By the end, you'll have transformed a 57MB dataset into an optimized database ready for lightning-fast analysis.
What You'll Learn
By the end of this tutorial, you'll know how to:
- Process large CSV files in chunks to avoid memory errors
- Identify and remove unnecessary columns to reduce dataset size
- Convert data types to more memory-efficient alternatives
- Load optimized data into SQLite for efficient querying
- Combine pandas and SQL for powerful data analysis workflows
- Diagnose encoding issues and handle non-UTF-8 files
- Create visualizations from aggregated database queries
Before You Start: Pre-Instruction
To make the most of this project walkthrough, follow these preparatory steps:
-
Review the Project
Access the project and familiarize yourself with the goals and structure: Analyzing Startup Fundraising Deals Project.
-
Access the Solution Notebook
You can view and download it here to see what we'll be covering: Solution Notebook
-
Prepare Your Environment
- If you're using the Dataquest platform, everything is already set up for you
- If working locally, ensure you have Python with pandas and sqlite3 installed
- Download the dataset from GitHub (October 2013 Crunchbase data)
-
Prerequisites
- Comfortable with Python basics (loops, dictionaries, data types)
- Basic familiarity with pandas DataFrames
- Some SQL knowledge is helpful but not required
New to Markdown? We recommend learning the basics to format headers and add context to your Jupyter notebook: Markdown Guide.
Setting Up Your Environment
Let's begin by importing pandas and understanding the challenge ahead:
import pandas as pd
Before we begin working with our dataset, let's understand our constraint. We're simulating a scenario where we only have 10MB of memory available for our analysis. While this specific limit is artificial for teaching purposes, the techniques we'll learn apply directly to real-world situations with datasets containing millions of rows.
Learning Insight: When I first started as a data analyst, I tried to load a 100,000-row dataset on my local machine and it crashed. I was blindsided because I didn't know about optimization techniques. Understanding what causes large memory usage and how to handle it are valuable skills that will save you countless hours of frustration.
Loading the Dataset with Chunking
Our first challenge: the CSV file isn't UTF-8 encoded. Let's handle this properly:
# This won't work - let's see the error
df = pd.read_csv('crunchbase-investments.csv')
When you try this, you'll get a UnicodeDecodeError. This is our first lesson in working with real-world data: it's often messy!
# Let's use chunking with proper encoding
chunk_iter = pd.read_csv('crunchbase-investments.csv',
                         chunksize=5000,
                         encoding='Latin-1')
Learning Insight: Latin-1 is a good fallback encoding when UTF-8 fails. Think of encoding like languages—if your computer expects English (UTF-8) but gets Spanish (Latin-1), it needs to know how to translate. The encoding parameter is just telling pandas which "language" to expect.
Now let's find out how big our dataset is:
cb_length = []

# Count rows across all chunks
for chunk in chunk_iter:
    cb_length.append(len(chunk))

total_rows = sum(cb_length)
print(f"Total rows in dataset: {total_rows}")
Total rows in dataset: 52870
Identifying Optimization Opportunities
Finding Missing Values
Columns with many missing values are prime candidates for removal:
# Re-initialize the chunk iterator (it's exhausted after one pass)
chunk_iter = pd.read_csv('crunchbase-investments.csv',
                         chunksize=5000,
                         encoding='Latin-1')

mv_list = []
for chunk in chunk_iter:
    if not mv_list:  # First chunk - get column names
        columns = chunk.columns
        print("Columns in dataset:")
        print(columns.sort_values())
    mv_list.append(chunk.isnull().sum())

# Combine missing value counts across all chunks
combined_mv_vc = pd.concat(mv_list)
unique_combined_mv_vc = combined_mv_vc.groupby(combined_mv_vc.index).sum()
print("\nMissing values by column:")
print(unique_combined_mv_vc.sort_values(ascending=False))
Columns in dataset:
Index(['company_category_code', 'company_city', 'company_country_code',
       'company_name', 'company_permalink', 'company_region',
       'company_state_code', 'funded_at', 'funded_month', 'funded_quarter',
       'funded_year', 'funding_round_type', 'investor_category_code',
       'investor_city', 'investor_country_code', 'investor_name',
       'investor_permalink', 'investor_region', 'investor_state_code',
       'raised_amount_usd'],
      dtype='object')

Missing values by column:
investor_category_code    50427
investor_state_code       16809
investor_city             12480
investor_country_code     12001
raised_amount_usd          3599
...
Learning Insight: The
investor_category_codecolumn has 50,427 missing values out of 52,870 total rows. That's over 95% missing! This column provides virtually no value and is a perfect candidate for removal. When a column is missing more than 75% of its values, it's usually safe to drop it entirely.
Analyzing Memory Usage
Let's see which columns are consuming the most memory:
chunk_iter = pd.read_csv('crunchbase-investments.csv',
                         chunksize=5000,
                         encoding='Latin-1')

counter = 0
series_memory_fp = pd.Series(dtype='float64')

for chunk in chunk_iter:
    if counter == 0:
        series_memory_fp = chunk.memory_usage(deep=True)
    else:
        series_memory_fp += chunk.memory_usage(deep=True)
    counter += 1

# Drop the index memory calculation
series_memory_fp_before = series_memory_fp.drop('Index').sort_values()
print("Memory usage by column (bytes):")
print(series_memory_fp_before)

# Total memory in megabytes
total_memory_mb = series_memory_fp_before.sum() / (1024 * 1024)
print(f"\nTotal memory usage: {total_memory_mb:.2f} MB")
Memory usage by column (bytes):
funded_year                  422960
raised_amount_usd            422960
investor_category_code       622424
...
investor_permalink          4980548
dtype: int64

Total memory usage: 56.99 MB
Our dataset uses nearly 57MB, far exceeding our 10MB constraint! The permalink columns (URLs) are the biggest memory hogs, making them great candidates to remove from our dataframe.
Implementing Optimization Strategies
Dropping Unnecessary Columns
Based on our analysis, let's remove columns that won't help our analysis:
# Columns to drop
drop_cols = ['investor_permalink',      # URL - not needed for analysis
             'company_permalink',        # URL - not needed for analysis
             'investor_category_code',   # 95% missing values
             'funded_month',            # Redundant - we have funded_at
             'funded_quarter',          # Redundant - we have funded_at
             'funded_year']             # Redundant - we have funded_at

# Get columns to keep
chunk = pd.read_csv('crunchbase-investments.csv', nrows=1, encoding='Latin-1')
keep_cols = chunk.columns.drop(drop_cols)
print("Columns we're keeping:")
print(keep_cols.tolist())
Learning Insight: Notice how we're only dropping
investor_category_codeamong the columns with missing data. Althoughinvestor_city,investor_state_code, andinvestor_country_codealso contain missing values, they didn't exceed the 75% threshold and were retained for potential future insights.
Also, we’re dropping the month, quarter, and year columns even though they have data. This follows the programming principle "Don't Repeat Yourself" (DRY). Since we have the full date in funded_at, we can extract month, quarter, or year later if needed. This saves us significant memory without losing information.
Identifying Data Type Optimization Opportunities
Let's check which columns can be converted to more efficient data types:
# Analyze data types across chunks
col_types = {}
chunk_iter = pd.read_csv('crunchbase-investments.csv',
                         chunksize=5000,
                         encoding='Latin-1',
                         usecols=keep_cols)

for chunk in chunk_iter:
    for col in chunk.columns:
        if col not in col_types:
            col_types[col] = [str(chunk.dtypes[col])]
        else:
            col_types[col].append(str(chunk.dtypes[col]))

# Get unique types per column
uniq_col_types = {}
for k, v in col_types.items():
    uniq_col_types[k] = set(col_types[k])

print("Data types by column:")
for col, types in uniq_col_types.items():
    print(f"{col}: {types}")
Now let's check unique value counts to identify categorical candidates:
unique_values = {}

chunk_iter = pd.read_csv('crunchbase-investments.csv',
                         chunksize=5000,
                         encoding='Latin-1',
                         usecols=keep_cols)

for chunk in chunk_iter:
    for col in chunk.columns:
        if col not in unique_values:
            unique_values[col] = set()
        unique_values[col].update(chunk[col].unique())

print("Unique value counts:")
for col, unique_vals in unique_values.items():
    print(f"{col}: {len(unique_vals)} unique values")
Unique value counts:
company_name: 11574 unique values
company_category_code: 44 unique values
company_country_code: 3 unique values
company_state_code: 51 unique values
...
funding_round_type: 10 unique values
Learning Insight: Any column with fewer than 100 unique values is a good candidate for the
categorydata type. Categories are incredibly memory-efficient for repeated string values. Think of it like a dictionary—instead of storing "USA" 10,000 times, pandas stores it once and uses a reference number.
Applying Optimizations
Let's load our data with all optimizations applied:
Note: We are converting funded_at to a datetime data type using the pd.read_csv optional parameter parse_dates
# Define categorical columns
col_types = {
    'company_category_code': 'category',
    'funding_round_type': 'category',
    'investor_state_code': 'category',
    'investor_country_code': 'category'
}

# Load with optimizations
chunk_iter = pd.read_csv('crunchbase-investments.csv',
                         chunksize=5000,
                         encoding='Latin-1',
                         usecols=keep_cols,
                         dtype=col_types,
                         parse_dates=['funded_at'])

# Calculate new memory usage
counter = 0
series_memory_fp_after = pd.Series(dtype='float64')

for chunk in chunk_iter:
    if counter == 0:
        series_memory_fp_after = chunk.memory_usage(deep=True)
    else:
        series_memory_fp_after += chunk.memory_usage(deep=True)
    counter += 1

series_memory_fp_after = series_memory_fp_after.drop('Index')
total_memory_after = series_memory_fp_after.sum() / (1024 * 1024)

print(f"Memory usage before optimization: 56.99 MB")
print(f"Memory usage after optimization: {total_memory_after:.2f} MB")
print(f"Reduction: {((56.99 - total_memory_after) / 56.99 * 100):.1f}%")
Memory usage before optimization: 56.99 MB
Memory usage after optimization: 26.84 MB
Reduction: 52.9%
We've cut our memory usage by more than half!
Loading into SQLite
Now let's load our optimized data into a SQLite database for efficient querying:
import sqlite3

# Create database connection
conn = sqlite3.connect('crunchbase.db')

# Load data in chunks and insert into database
chunk_iter = pd.read_csv('crunchbase-investments.csv',
                         chunksize=5000,
                         encoding='Latin-1',
                         usecols=keep_cols,
                         dtype=col_types,
                         parse_dates=['funded_at'])

for chunk in chunk_iter:
    chunk.to_sql("investments", conn, if_exists='append', index=False)

# Verify the table was created
cursor = conn.cursor()
cursor.execute("SELECT name FROM sqlite_master WHERE type='table';")
tables = cursor.fetchall()
print(f"Tables in database: {[t[0] for t in tables]}")

# Preview the data
cursor.execute("SELECT * FROM investments LIMIT 5;")
print("\nFirst 5 rows:")
for row in cursor.fetchall():
    print(row)
Learning Insight: SQLite is perfect for this use case because once our data is in the database, we don't need to worry about memory constraints anymore. SQL queries are incredibly fast and efficient, especially for aggregation operations. What would require complex pandas operations with chunking can be done in a single SQL query.
Analyzing the Data
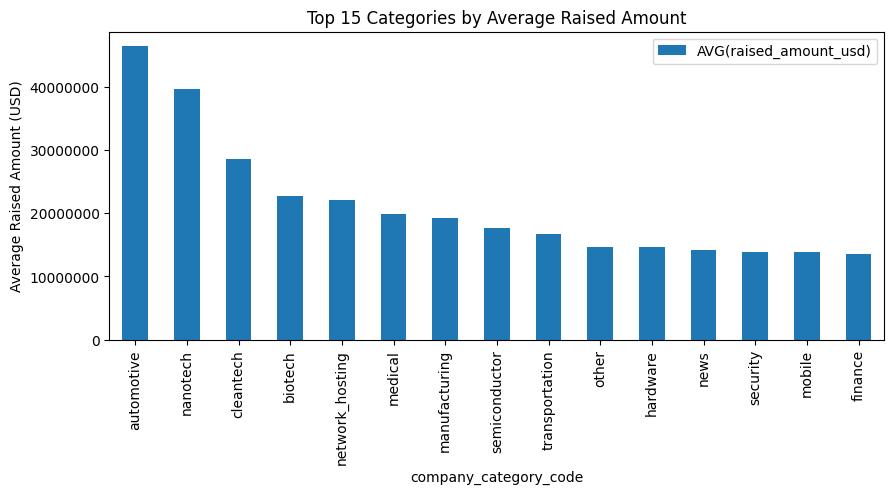
Let’s answer a business question: Which categories of companies attract the most investment on average?
# Use pandas to read SQL results directly into a DataFrame
query = """
    SELECT company_category_code,
           AVG(raised_amount_usd) as avg_raised
    FROM investments
    WHERE raised_amount_usd IS NOT NULL  -- Exclude nulls for accurate average
    GROUP BY company_category_code
    ORDER BY avg_raised DESC;
"""

df_results = pd.read_sql(query, conn)
# Visualize top 15 categories
top_n = 15
ax = df_results.head(top_n).set_index('company_category_code').plot(
    kind='bar',
    figsize=(10, 6),
    title=f'Top {top_n} Categories by Average Investment Amount',
    ylabel='Average Investment (USD)',
    legend=False
)

# Format y-axis to show actual numbers instead of scientific notation
ax.ticklabel_format(style='plain', axis='y')
plt.tight_layout()
plt.show()
Key Takeaways and Next Steps
Through this project, we've learned essential techniques for handling large datasets:
- Chunking prevents memory errors: Process data in manageable pieces when the full dataset exceeds memory
- Data type optimization matters: Converting to categories and appropriate numeric types can reduce memory by 50% or more
- Remove redundant columns: Don't store the same information multiple ways
- SQLite enables fast analysis: Once optimized and loaded, complex queries run in seconds
- Encoding issues are common: Real-world data often isn't UTF-8; know your alternatives
More Projects to Try
We have some other project walkthrough tutorials you may also enjoy:
- Project Tutorial: Build Your First Data Project
- Project Tutorial: Profitable App Profiles for the App Store and Google Play Markets
- Project Tutorial: Investigating Fandango Movie Ratings
- Project Tutorial: Analyzing New York City High School Data
- Project Tutorial: Analyzing Helicopter Prison Escapes Using Python
- Project Tutorial: Build A Python Word Guessing Game
- Project Tutorial: Predicting Heart Disease with Machine Learning
- Project Tutorial: Customer Segmentation Using K-Means Clustering
- Project Tutorial: Answering Business Questions Using SQL
- Project Tutorial: Predicting Insurance Costs with Linear Regression
- Project Tutorial: Finding Heavy Traffic Indicators on I-94
- Project Tutorial: Star Wars Survey Analysis Using Python and Pandas
- Project Tutorial: Build an AI Chatbot with Python and the OpenAI API
- Project Tutorial: Build a Web Interface for Your Chatbot with Streamlit (Step-by-Step)
Homework Challenges
To deepen your understanding, try extending this project with:
- Further optimization: Can you convert
raised_amount_usdfrom float64 to float32 or smaller? Test if this maintains adequate precision. - Advanced analysis questions:
- What proportion of total funding did the top 10% of companies receive?
- Which investors contributed the most money overall?
- Which funding rounds (seed, Series A, etc.) are most common?
- Are there seasonal patterns in funding? (Hint: use the
funded_atcolumn)
- Data quality: Investigate why the original CSV isn't UTF-8 encoded. Can you find and fix the problematic characters?
Personal Reflection: As someone who transitioned from teaching math to data analysis, I remember being intimidated by memory issues and encoding errors. But these challenges taught me that real-world data is messy, and learning to handle that messiness is what separates good analysts from great ones. Every optimization technique you learn makes you more capable of tackling bigger, more interesting datasets.
This project demonstrates that with the right techniques, you can analyze datasets much larger than your available memory. Whether you're working with startup data, customer records, or sensor readings, these optimization strategies will serve you well throughout your data career.
If you're new to pandas and found the chunking concepts challenging, start with our Processing Large Datasets in Pandas course. For those ready to dive deeper into data engineering, check out our Data Engineering path.
Happy analyzing!