The Dataquest Download
Level up your data and AI skills, one newsletter at a time.
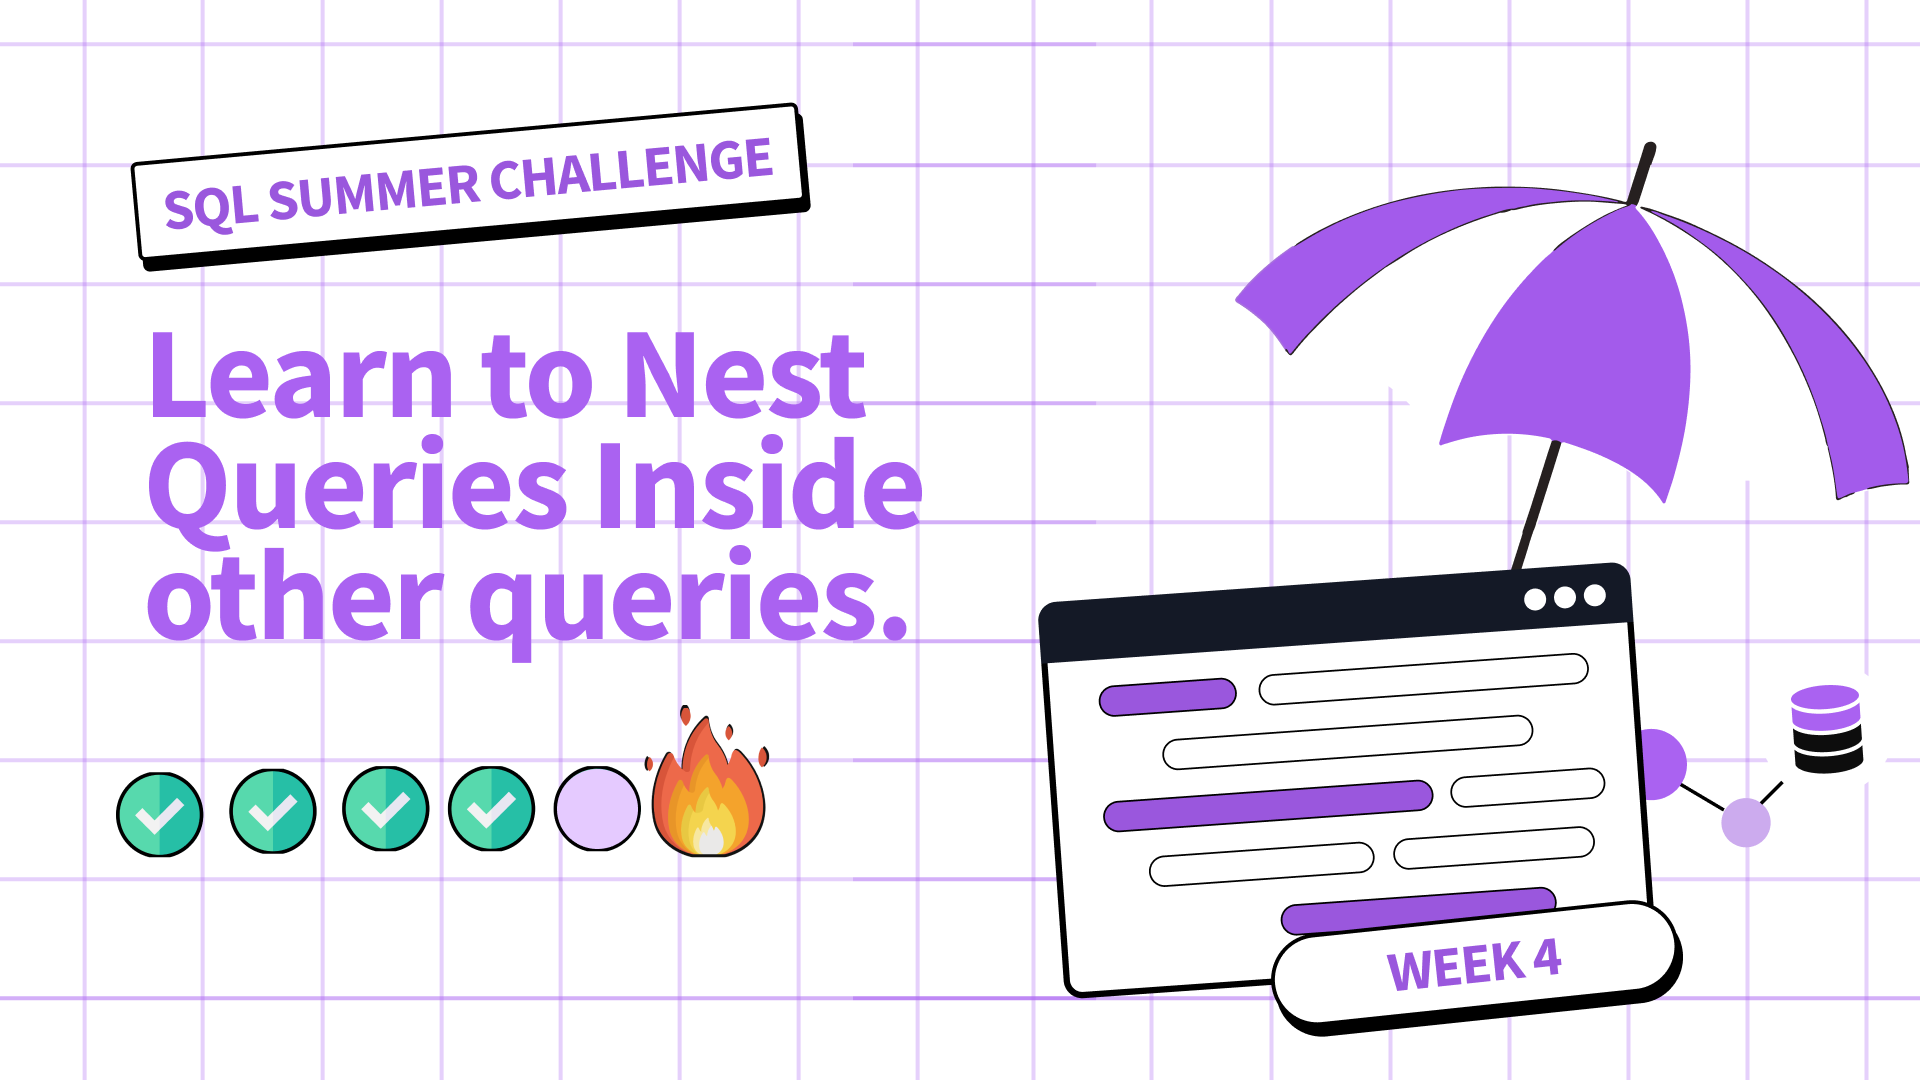
Learn to Nest Queries Inside Other Queries
Dear Dataquesters–
It’s Casey again. This week, I want to share something that’s made a significant difference in our work: SQL subqueries. Don’t worry if that sounds complicated – I’ll break it down for you.
Think of SQL subqueries like searching for a book in a library. You start by finding the right section (main query), and then you drill down to locate the exact book you need (subquery). This nested approach helps you quickly zero in on specific information, saving you time and effort. By using SQL subqueries, you can uncover insights that might have been hidden in your data, and make more informed decisions as a result.
A while back, we faced a challenge at Dataquest. We needed to track bugs in our content, ensure we were fixing them on time, and decide which ones to prioritize. It was a big task, but SQL subqueries helped us out.
One way we utilize subqueries is through Common Table Expressions, or CTEs. If you’re not familiar with these, think of them as temporary result sets that we can use in our main query. By using CTEs, we were able to break down our complex problem into manageable steps. First, we’d gather all the bugs. Then, we’d identify the ones that were taking too long to fix.
As I continued working with subqueries, I realized how powerful they are. Now, we can quickly determine if we’re meeting our goals for fixing bugs. We can even group bugs based on whether they’re fixed and how long they’ve been open. It’s incredibly useful for organizing data.
One of my favorite aspects of subqueries is how they help us analyze data over time. We can now easily see how many bugs we get each week, month, or year, all in one query.
That’s why I’m excited about Week 4 of our SQL summer challenge. We’ll be exploring our SQL Subqueries course, where you’ll learn about different types of subqueries and practice with real-world scenarios, just like the ones we deal with at Dataquest.
Whether you’re just starting out with SQL or already on this challenge with us, I highly recommend this course. With SQL subquery skills, you can solve a challenging data problem independently.
So, how might you use subqueries in your work? Well, if you ever need to compare data to a summary (like finding all sales above the average) or if you need to filter based on a condition from another table, subqueries are your go-to solution. They’re also great for those “find the top N” type questions.
Next week, we’ll discuss another cool SQL topic: window functions. But for now, I hope you enjoy learning how to build SQL subqueries!
Casey
Week 4 SQL Summer Challenge
In the SQL Subqueries course, you’ll learn how to nest queries inside other queries, enabling you to write more powerful and scalable SQL queries. This self-paced course consists of 6 lessons and takes only 6 hours to complete. By the end, you’ll have learned:
- Scalar Subqueries: Understand how to use subqueries that return a single value.
- Multi-row and Multi-column Subqueries: Learn how to work with subqueries that return multiple rows and columns.
- Nested and Correlated Subqueries: Dive into more complex subqueries that depend on the outer query.
- Common Table Expressions (CTEs): Write CTEs to simplify complex queries and improve readability.
- Views in SQL: Create and use views to present data in a specific format without altering the underlying tables.
- Guided Project: Customers and Products Analysis Using SQL: Apply your skills in a real-world project analyzing customer and product data.
What's new
Give 20% Get $20
Now is the perfect time to share Dataquest with a friend. Gift a 20% discount, and for every friend who subscribes, earn a $20 bonus. Use your bonuses for digital gift cards, prepaid cards, or donate to charity. Your choice! Click here
Community highlights
Project Spotlight
Sharing and reviewing others’ projects is one of the best things you can do to sharpen your skills. Twice a month we will share a project from the community. The top pick wins a $20 gift card!
This edition, we spotlight Dataquest learner Mohammad Ghafouri, who showcased a data visualization storytelling project: The Case of Euro-USD Exchange Rates. He exceptionally reported interesting data on easily consumable and detailed plots. The project perfectly illustrates why (and how) we should look at the same data using different plot types.
|
Want your project in the spotlight? Share it in the community. |
|
Learner Tip of the Week
|
High-fives from Vik, Celeste, Casey, Anna P, Anna S, Anishta, Bruno, Elena, Mike, Daniel, and Brayan.