Power BI Cheat Sheet PDF
This Power BI cheat sheet provides a quick reference for essential Power BI features and functionalities, helping you analyze data, create interactive reports, and design insightful dashboards with ease. It covers a wide range of categories, including data interaction, transformation, modeling, analytics, visualization, and workspace, ensuring you have the tools needed to perform tasks from basic data exploration to advanced scenario modeling.
Each entry includes clear syntax and concise explanations, paired with practical examples to demonstrate how the feature operates in real-world scenarios. Whether you’re writing DAX formulas, transforming or designing semantic models, or creating advanced visualizations, this cheat sheet simplifies Power BI’s robust capabilities.
Designed to be accessible and actionable, this resource is perfect for professionals, students, and business analysts looking to improve their efficiency and confidence in Power BI. Keep it handy for quick guidance on Power BI’s versatile functionality.
Table of Contents

CALCULATE
SUM
AVERAGE
TOTALYTD
LASTDATE
PATH
USERELATIONSHIP
CALENDAR
CALENDARAUTO
RELATED
CONCATENATE
DIVIDE
IF
DISTINCTCOUNT
RANKX
SWITCH
FORMAT
VALUES
EARLIER
ALLEXCEPT
FILTER
ALL
HASONEVALUE
MAX
MIN
COUNTROWS
SUMMARIZE
LOOKUPVALUE
ISBLANK
ROUND

ADDITION (+)
SUBTRACTION (-)
MULTIPLICATION (*)
DIVISION (/)
EXPONENTIATION (^)
CONCATENATION (&)
EQUAL TO (=)
NOT EQUAL TO (<>)
GREATER THAN (>)
LESS THAN (<)
GREATER THAN OR EQUAL (>=)
LESS THAN OR EQUAL (<=)
LOGICAL AND (&&)
LOGICAL OR (||)
LOGICAL NOT (NOT)
INCLUSION (IN)
PARENTHESIS (())
TABLE CONSTRUCTOR ({})
EQUALITY FOR RELATIONSHIPS (=)

POWER BI WORKFLOWS
CONNECT TO DATA
DATA TRANSFORMATION
PUBLISH REPORTS
MANAGE DATA SOURCES

VIEW MODEL LAYOUT
CREATE RELATIONSHIPS
AUTODETECT RELATIONSHIPS
MARK A TABLE AS A DATE TABLE
CREATE DAX MEASURES
CREATE DAX CALCULATED COLUMNS
HIERARCHIES IN DIMENSION TABLES
MANAGE CARDINALITY
FLATTEN HIERARCHIES
PERFORMANCE OPTIMIZATION
AGGREGATION COLUMNS
BIDIRECTIONAL CROSS-FILTERING
CREATE QUICK MEASURES
CONCATENATE COLUMNS
CIRCULAR RELATIONSHIP DETECTION
USE AGGREGATION MANAGER

ADD VISUALS
TOOLTIPS
CONDITIONAL FORMATTING
ADD SLICER
SORTING DATA
FILTERS
BACKGROUND AND BORDERS
DRILLTHROUGH
BOOKMARKS
BUTTONS
ALIGN AND DISTRIBUTE VISUALS
HIERARCHY
ADD ALT TEXT
KEY PERFORMANCE INDICATORS (KPIS)
VISUALIZATION MARKETPLACE
CLUSTERING
TOP N ANALYSIS
HISTOGRAMS AND BELL CURVES
ANALYZE FEATURE
AI INSIGHTS
KEY INFLUENCERS VISUAL
DECOMPOSITION TREE
Q&A VISUAL
STATISTICAL SUMMARY
ADVANCED ANALYTICS VISUALS
TIME SERIES ANALYSIS
SLICERS
CUSTOM BIN GROUPS
QUICK INSIGHTS

PROMOTE HEADERS
RENAME QUERIES
RENAME COLUMNS
REPLACE VALUES
REMOVE ROWS
REMOVE BLANK ROWS
REMOVE COLUMNS
REMOVE DUPLICATES
PIVOT COLUMNS
UNPIVOT COLUMNS
SPLIT COLUMNS
COMBINE COLUMNS
SORT COLUMNS
GROUP BY
MERGE QUERIES
DUPLICATE COLUMNS
TRANSPOSE DATA
FILL DOWN/UP
CHANGE COLUMN DATA TYPE
FIND ANOMALIES
MODIFY M CODE
ADD CONDITIONAL COLUMNS
COMBINE FILES

CREATE A WORKSPACE
ASSIGN WORKSPACE ROLES
DEPLOYMENT PIPELINES
LINEAGE VIEW
USAGE METRICS
SENSITIVITY LABELS
SCHEDULED REFRESH
PROMOTE AND CERTIFY DATASETS
IMPLEMENT ROW-LEVEL SECURITY (RLS)
TEST RLS ROLES
GATEWAYS FOR ON-PREMISES DATA
PARAMETERS FOR DYNAMIC REPORTS
WHAT-IF PARAMETERS
MANAGE SEMANTIC MODELS
CREATE DYNAMIC MEASURES
DAX Functions
Syntax for
How to use
Explained
CALCULATE
CALCULATE(Expression, Filters)
Modifies the filter context of an expression, enabling advanced calculations like conditional totals or time intelligence analysis.
SUM
SUM(Table[Column])
Adds all numerical values in a column, commonly used in measures.
AVERAGE
AVERAGE(Table[Column])
Calculates the average of a column's numerical values.
TOTALYTD
TOTALYTD(Table[Column])
Calculates the Year-To-Date total for an expression.
LASTDATE
LASTDATE(Dates[Column])
Returns the last date in a given date column, often used in semi-additive measures.
PATH
PATH(Table[Child_Column], Table[Parent_Column])
Creates a string that shows the hierarchical path from a parent to a child.
USERELATIONS HIP
USERELATIONSHIP(Table1[Column1], Table2[Column2])
Activates an inactive relationship between two tables for a specific calculation.
CALENDAR
CALENDAR(START_DATE, END_DATE)
Generates a continuous range of dates between two specified dates.
CALENDARAUTO
CALENDARAUTO()
Automatically creates a date table based on the minimum and maximum values of date columns in the model.
RELATED
RELATED(Table[Column])
Retrieves a related value from another table using an existing relationship.
CONCATENATE
CONCATENATE(Value1, Value2)
Combines two values into a single text string.
DIVIDE
DIVIDE(Numerator, Denominator, AlternateResult)
Performs division while handling divide-by-zero errors gracefully by returning an alternate result.
IF
IF(Condition, TrueResult, FalseResult)
Evaluates a condition and returns different results based on whether the condition is true or false.
DISTINCTCOUNT
DISTINCTCOUNT(Table[Column])
Counts the number of unique values in a column.
RANKX
RANKX(Table, Expression, Value, Order, Ties)
Returns the rank of a value in a table based on an expression, with options for handling ties.
SWITCH
SWITCH(Expression, Value1, Result1, [Value2, Result2], ..., [ElseResult])
Evaluates an expression and returns a matching result for the first case.
FORMAT
FORMAT(Value, FormatString)
Formats a value as a string using a specified format (e.g., currency, percentage).
VALUES
VALUES(Table[Column])
Returns a single-column table with unique values from the specified column.
EARLIER
EARLIER(Column, Offset)
Refers to a row context in an earlier iteration of the same calculation.
ALLEXCEPT
ALLEXCEPT(Table, Column1, Column2, ...)
Removes all filters except those applied to the specified columns.
FILTER
FILTER(Table, Condition)
Returns a table that contains only rows matching a specified condition.
ALL
ALL(Table[Column])
Removes all filters from a table or column, returning all rows.
HASONEVALUE
HASONEVALUE(Table[Column])
Returns TRUE if the column contains only one distinct value in the current filter context.
MAX
MAX(Table[Column])
Returns the largest numeric value in a column.
MIN
MIN(Table[Column])
Returns the smallest numeric value in a column.
COUNTROWS
COUNTROWS(Table)
Counts the number of rows in a table.
SUMMARIZE
SUMMARIZE(Table, GroupByColumnName, [Name, Expression], ...)
Groups data by specified columns and calculates aggregated values.
LOOKUPVALUE
LOOKUPVALUE(Result_Column, Search_Column, Search_Value, [Search_Column2, Search_Value2])
Returns the value of a result column based on search criteria.
ISBLANK
ISBLANK(Value)
Returns TRUE if the specified value is blank.
ROUND
ROUND(Number, NumDigits)
Rounds a number to the specified number of digits.
DAX Operators
Syntax for
How to use
Explained
Addition (+)
Sales[Amount] + Sales[Tax]
Adds two numerical values or columns.
Subtraction (-)
Sales[Amount] - Sales[Discount]
Subtracts one numerical value or column from another.
Multiplication (*)
Sales[Price] * Sales[Quantity]
Multiplies two numerical values or columns.
Division (/)
Sales[Total] / Sales[Units]
Divides one numerical value or column by another.
Exponentiation (^)
Value ^ 2
Raises a number to the power of another number.
Concatenation (&)
Customer[FirstName] & " " & Customer[LastName]
Combines two text strings into one.
Equal To (=)
Sales[Category] = "Electronics"
Compares two values for equality.
Not Equal To (<>)
Sales[Category] <> "Electronics"
Compares two values for inequality.
Greater Than (>)
Sales[Price] > 100
Checks if one value is greater than another.
Less Than (<)
Sales[Price] < 100
Checks if one value is less than another.
Greater Than or Equal (>=)
Sales[Price] >= 100
Checks if one value is greater than or equal to another.
Less Than or Equal (<=)
Sales[Price] <= 100
Checks if one value is less than or equal to another.
Logical AND (&&)
(Sales[Price] > 100) && (Sales[Units] > 10)
Returns TRUE if both conditions are true, otherwise FALSE.
Logical OR (||)
(Sales[Price] > 10) || (Sales[Units] > 10)
Returns TRUE if at least one condition is true, otherwise FALSE.
Logical NOT (NOT)
NOT(Sales[Category] = "Electronics")
Reverses the logical value of an expression (TRUE to FALSE and vice versa).
Inclusion (IN)
Sales[Category] IN {"ELECTRONICS","BOOKS"}
Checks if a value exists in a specified list of values and returns TRUE or FALSE.
Parenthesis (())
(Sales[Price] + Sales[Tax]) * Sales[Units]
Groups expressions or specifies the order of operations in calculations.
Table Constructor ({})
{1, 2, 3}
Creates a table with a single column containing the listed values.
Equality for Relationships (=)
Customer[ID] = Sales[CustomerID]
Creates relationships between tables based on key columns.
Data Interaction
Syntax for
How to use
Explained
Power BI Workflows
> Connect to data
> Transform and model data
> Create visualizations
> Publish and share
Workflow includes importing data from sources like Excel or CSV, transforming data in Power Query Editor, building reports, and sharing insights via Power BI Service.
Connect to Data
> Home
> Get data
> Select File Type (e.g., CSV, Excel)
> Open File
> Load or Transform Data
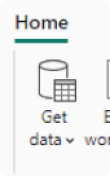
Easily connect to various data sources like Excel, CSV, XML, or databases, and load them into Power BI for further processing.
Data Transformation
> Home
> Transform data
> Use Power Query Editor
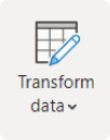
Clean and shape your data, such as renaming columns, filtering rows, and changing data types, to prepare it for analysis.
Publish Reports
> File
> Publish
> Power BI Service
Share your reports with others by publishing them to Power BI Service, where dashboards and access can be managed.
Manage Data Sources
> Transform Data
> Data Source Settings
>Change Source

Update data source paths or settings to maintain the accuracy of your reports when file locations change.
Data Modeling
Syntax for
How to use
Explained
View Model Layout
> Home Tab
> Model view
> View Diagram
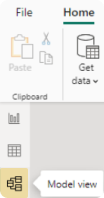
Allows managing table relationships, creating measures, and organizing data for effective data modeling.
Create Relationships
> Modeling Tab
> Manage Relationships
> New
> Choose Columns
> Define Cardinality
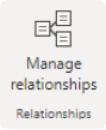
Establish connections between tables using key columns, defining cardinality (e.g., many-to-one, oneto-one).
Autodetect Relationships
> Modeling Tab
> Manage Relationships
> Autodetect

Automatically identifies and creates relationships between tables based on column names and data types.
Mark a Table as a Date Table
> Data Pane
> Right-click Table
> Mark as Date Table
> Select Date Column

Assigns a table as the primary date table, ensuring accurate time-based calculations and filtering.
Create DAX Measures
> Data Pane
> Right-click
> New Measure

Use DAX to calculate values like sums, averages, or percentages, enabling dynamic and reusable calculations.
Create DAX Calculated Columns
> Data Pane
> Right-click
> New Column
> Enter DAX Formula

Add new columns derived from existing ones, materialized into the dataset, increasing file size.
Hierarchies in Dimension Tables
> Data Pane
> Right-click
> New Hierarchy

Organize columns (e.g., Year > Month > Day) into a hierarchy for drill-down capabilities in visualizations.
Manage Cardinality
> Modeling Tab
> Manage Relationships
> New
> Define Cardinality (e.g., Many-to-One, Oneto-Many)

Adjusts how tables relate to each other (e.g., many-to-many for flexible connections).
Flatten Hierarchies
> Model Tab
> View Diagram
> Select Flattened Table Option
Breaks down hierarchical relationships into a single-level table for simpler analysis.
Performance Optimization
> View Tab
> Performance Analyzer
Analyzes report performance, identifying areas for improvement like visuals or DAX queries.
Aggregation Columns
> Power Query Editor
> Group By
> Add Aggregation
Pre-aggregate data by grouping and summarizing at desired levels of detail.
Bidirectional Cross-Filtering
> Manage Relationships
> Enable Bi-Directional Filtering
Allows filters to flow both ways in relationships, ensuring comprehensive filtering.
Enable Auto Date/Time
> File
> Options
> Data Load
> Auto Date/Time for New Files
Automatically generates date hierarchies for date columns, simplifying time-based analysis.
Create Quick Measures
> Data Pane
> Right-click
> New Quick Measure

Generate commonly used calculations like totals or averages without writing DAX.
Concatenate Columns
> Power Query Editor
> Add Column
> Custom Column
> Define Concatenation Formula
Combine multiple columns into a single column (e.g., concatenating Year and Month to create "MonthYear").
Circular Relationship Detection
> Model Tab
> Analyze Relationships
> Resolve Circular References
Identifies and resolves circular dependencies in relationships to avoid calculation errors.
Use Aggregation Manager
> Data Pane
> Right-click Table
> Manage Aggregations
Defines pre-aggregations for tables, improving performance when querying large datasets.
Power BI Visuals and Analytics
Syntax for
How to use
Explained
Add Visuals
> Visualizations Pane
> Select Visual Icon (e.g., Table, Chart)

Allows adding visuals such as tables, bar charts, line charts, etc., to represent data insights effectively.
Tooltips
> Format Pane
> Tooltip Section
> Configure Custom Tooltip

Adds customized hover-over descriptions for enhanced data context in visuals.
Conditional Formatting
> Format Pane
> Conditional Formatting Options
Specifies cell colors, data bars, KPI icons, or web links based on field values.
Add Slicer
> Visualizations Pane
> Slicer Icon
> Drag Fields to Slicer Visualization

Adds a slicer to filter data interactively by specific criteria (e.g., year or region).
Sorting Data
> More Options (Three Dots)
> Sort Ascending/Descending or By Field
Organizes data logically, highlighting the most relevant information without removing any.
Filters
> Drag Fields to Filter Pane
> Configure Filters

Removes unnecessary data, enabling focus on relevant information in reports.
Background and Borders
> Format Pane
> Background/Border Sections
> Configure Color or Image

Adds visual elements like colors or borders to highlight and isolate specific visuals on the canvas.
Drillthrough
> Add Drillthrough Fields
> Configure Target Page
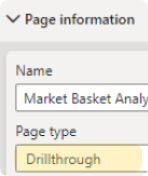
Allows users to navigate to detailed pages for in-depth analysis by clicking on a specific field or value.
Bookmarks
> View Tab
> Bookmarks
> Add Bookmark

Saves the current view of a report page for quick access, enhancing navigation and storytelling.
Buttons
> Insert Tab
> Buttons
> Add Button
> Configure Action (e.g., Page Navigation)
Adds interactive buttons for navigation or specific actions in a report.
Align and Distribute Visuals
> CTRL + Click Visuals
> Format Tab
> Align/Distribute Options

Aligns and evenly distributes visuals on the canvas for a clean, professional layout.
Hierarchy
> Data Pane
> Drag Fields to Create Hierarchy

Groups data into hierarchical levels (e.g., Year > Month > Day) for drill-down capabilities.
Add Alt Text
> Format Pane
> General Section
> Alt Text
> Enter Description

Ensures accessibility by providing descriptions for visuals that screen readers can interpret.
Key Performance Indicators (KPIs)
> Visualizations Pane
> KPI Icon
> Add Value, Goal, and Time Frame

Tracks performance against a target using metrics, goals, and timelines (e.g., total sales vs. sales target).
Clustering
> Scatter Chart
> More Options
> Automatically Find Clusters
Analyzes and groups similar data points in a scatter chart based on attribute values.
Top N Analysis
> Filters Pane
> Field
> Filter Type
> Top N

Displays the top N records based on a selected value (e.g., Top 10 selling products).
Histograms and Bell Curves
Use Column Charts for Histograms;
Use Area Charts for Bell Curves
Represents statistical data distributions for insights into data patterns.
Analyze Feature
> Right-click Visual Data Point
> Analyze
> Choose Option (Explain Increase or Distribution Differences)
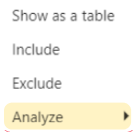
Provides AI-generated insights into why data has changed or it distribution differences.
AI Insights
> Power Query Editor
> Add Column Tab
> Select Text Analytics, Vision, or Azure Machine Learning
Applies pretrained machine learning models for tasks like sentiment analysis, image processing, or anomaly detection.
Key Influencers Visual
> Visualizations Pane
> Key Influencers Icon
> Add Metric to Analyze and Dimensions to Explain By

Identifies and ranks factors that influence a specific metric, aiding in root cause analysis.
Decomposition Tree
> Visualizations Pane
> Decomposition Tree Icon
> Add Fields to Analyze and Explain

Allows data exploration across multiple dimensions, providing insights into high and low values in hierarchical data.
Q&A Visual
> Double-Click Canvas
> Enter Natural Language Question
Uses natural language processing to generate visual answers to datarelated questions.
Statistical Summary
> Visualizations Pane
> Add Summary Visual

Provides quick descriptive statistics like averages, distributions, and clusters for high-level insights.
Advanced Analytics Visuals
> Visualizations Pane
> Get More Visuals
> Select Advanced Analytics Category
Imports specialized visuals from Microsoft AppSource for complex analytical needs.
Time Series Analysis
Use Line Charts, Gantt Charts, or Area Charts
Tracks and visualizes data trends over time, useful for identifying disruptions or seasonal patterns.
Slicers
> Visualizations Pane
> Slicer Icon
> Add Field to Slicer

Filters data interactively by categories such as time or geography, enabling segmentation of data.
Custom Bin Groups
> Data Pane
> Right-click Field
> New Group
> Set Bin Size

Groups continuous data (e.g., numerical values or dates) into equal intervals for better analysis.
Quick Insights
> Power BI Web Service
> Report
> More Options
> Quick Insights
Automatically generates insights using machine learning algorithms, ideal for initial dashboard exploration.
Transform Data in Power BI
Syntax for
How to use
Explained
Promote Headers
> Home
> Use First Row as Headers

Converts the first row of data into column headers.
Rename Queries
> Queries Pane
> Right-click on Query
> Rename
Updates query names to make them meaningful and organized.
Rename Columns
> Right-click on column
> Rename OR Double-click column header
> Enter new name
Updates column names for clarity and organization of the dataset.
Replace Values
> Transform Tab
> Replace Values
> Enter Value to Find and Replace
> Close & Apply
Substitutes specific values or nulls with new ones to resolve inconsistencies or make values user-friendly.
Remove Rows
> Select rows
> Home
> Remove Rows
> Remove Top Rows

Deletes unnecessary rows to clean the dataset and improve analysis accuracy.
Remove Columns
> Select columns
> Home
> Remove Columns OR Remove Other Columns
Deletes unwanted columns or retains only necessary ones.
Remove Duplicates
> Right-click Column Header
> Remove Duplicates
Eliminates duplicate values to ensure accuracy and uniqueness in data.
Pivot Columns
> Transform
> Pivot Column
> Select Value Column
> Choose Aggregate Function
Summarizes data by converting rows into columns using aggregate functions like SUM, COUNT, or AVERAGE.
Unpivot Columns
> Select columns
> Transform
> Unpivot Columns
Converts column data into rows, enabling easier analysis of wide datasets.
Split Columns
> Home
> Split Column
> By Delimiter
Divides a column into two or more based on a specified delimiter (e.g., comma, space).
Combine Columns
> Add Column
> Custom Column
> Concatenate values with delimiter
Merges multiple columns into one, improving readability or preparing data for analysis.
Sort Columns
> Home
> Sort Ascending/Descending
> Choose column
Reorders data within a column alphabetically, numerically, or by other criteria.
Group By
> Transform
> Group By
> Select column(s)
> Define operation (SUM, COUNT, etc.)

Aggregates data based on selected columns to perform calculations like sums or counts.
Merge Queries
> Home
> Merge Queries
> Choose Tables and Columns
> Select Join Type
Combines data from multiple queries into one using a join operation (e.g., INNER JOIN, OUTER JOIN).
Duplicate Columns
> Right-click column
> Duplicate Column
Creates a copy of a column for further transformations without altering the original.
Transpose Data
> Transform
> Transpose
Switches rows to columns or columns to rows for reformatting data.
Fill Down/Up
> Transform
> Fill
> Fill Down or Fill Up

Fills blank cells in a column with values from the cell above or below.
Combine Files
> Home
> Combine Files
> Select Folder
Consolidates data from multiple files (e.g., Excel or CSV) into one query.
Change Column Data Type
> Select Column
> Transform Tab
> Data Type
> Choose Correct Data Type
Fixes data type issues by selecting the correct type for calculations and transformations.
Find Anomalies
> View Tab
> Data Preview
> Check Column Distribution, Quality, and Profile
Identifies irregularities or quality issues in data through visual summaries like column statistics and value distributions.
Modify M Code
> View Tab
> Advanced Editor
> Edit Code
> Click Done
Edits the underlying M code for advanced or customized transformations.
Add Conditional Columns
> Home
> Add Column
> Conditional Column
> Define conditions and values
Adds a new column based on defined conditions (e.g., categorizing data into ranges).
Workspaces and Security
Syntax for
How to use
Explained
Create a Workspace
> Power BI Service
> Workspaces
> Create a Workspace
Enables you to organize and collaborate on dashboards, reports, and datasets.
Assign Workspace Roles
> Workspace
> Access
> Add Email or Group
> Assign Role (Admin, Member, Contributor, Viewer)
Defines user permissions for collaboration and content management within the workspace.
Deployment Pipelines
> Power BI Service
> Deployment Pipelines
> Create Pipeline
> Configure Workspace
Manages content migration between development, testing, and production environments (Premium accounts only).
Lineage View
> Workspace
> View Drop-Down
> Lineage
Visualizes relationships between workspace artifacts (reports, datasets) and external dependencies.
Usage Metrics
> Workspace
> Report
> More Options
> View Usage Metrics
Tracks performance and user interaction metrics for reports and dashboards.
Sensitivity Labels
> Power BI Desktop
> Apply Sensitivity Labels
> Publish
Protects sensitive data by specifying export permissions.
Scheduled Refresh
> Dataset
> Settings
> Scheduled Refresh
Automates data updates to ensure reports and dashboards display the latest information.
Promote and Certify Datasets
> Power BI Service
> Dataset
> Promote or Certify
Endorses high-quality datasets for organizational use, ensuring reliability and consistency.
Test RLS Roles
> Power BI Desktop
> Modeling Tab
> View as Roles
Simulates role-specific views to verify correct implementation of row-level security.
Gateways for On-Premises Data
> Install Power BI Gateway
> Configure Gateway in Power BI Service
Connects on-premises data sources to Power BI cloud services, enabling seamless data access and refresh.
Parameters for Dynamic Report
> Power Query Editor
> Manage Parameters
> Create New Parameter
> Replace Filter with Parameter
Enables dynamic filtering of reports based on user input or predefined values.
What-If Parameters
> Modeling Tab
> New Parameter
> Define Parameter
> Create Measure
Runs scenario analysis by dynamically changing parameter values (e.g., forecasting sales impact with variable discounts).
Manage Semantic Models
> Power BI Desktop
> Create Relationships
> Define Star Schema
Organizes data into fact and dimension tables for optimized performance and analysis.
Create Dynamic Measures
DAX: Measure = (Data[Field]) * Parameter[Value]Dynamically changes calculations in reports based on input parameters.