25 Must-Know Power BI Interview Questions and Answers
Business intelligence skills are essential in today's data-driven workplace, and Power BI remains the leading analytics tool used by organizations worldwide. To help you confidently prepare for your next job opportunity, we've compiled a list of essential Power BI interview questions that hiring managers frequently ask.
Power BI Interview Questions: Fundamentals
Let's begin with some foundational Power BI interview questions. While these may seem straightforward, providing confident, clear, and concise answers will demonstrate your expertise and readiness right from the start.

1. What is Power BI?
|
What the interviewer wants to know:
They’re trying to gauge if you understand how businesses practically benefit from using Power BI, beyond just technical features. |
How to approach answering:
Provide clear, real-world examples that highlight how businesses commonly leverage Power BI. Keep your language simple, practical, and focused on benefits rather than technical jargon. |
How you might respond:
Power BI is a tool from Microsoft that lets you easily collect data from different places, analyze and visualize it, and build interactive dashboards and reports. Basically, it helps businesses turn raw data into understandable visuals, making it much simpler for teams to spot trends, track performance metrics, and make informed decisions. Power BI also includes powerful AI features and even lets users ask questions using everyday language, making data analysis intuitive, even if you’re not highly technical.
Practical interview tip: When answering this question, it’s helpful to briefly connect your explanation to a specific business scenario (like improving sales or customer satisfaction) to demonstrate you truly understand the practical value Power BI delivers.

2. What are the advantages of Power BI?
|
What the interviewer wants to know:
They're assessing your understanding of Power BI’s strengths and why businesses choose it over other BI tools. |
How to approach answering:
Clearly highlight key advantages by grouping them into practical themes such as ease of use, connectivity, speed, interactivity, and advanced capabilities. Mention features that demonstrate your awareness of Power BI’s strengths. |
How you might respond:
Power BI stands out for several reasons:
- User-friendly: It’s intuitive and accessible, even if you don't have extensive technical experience.
- Powerful ETL Capabilities: Efficiently extracts, transforms, and loads data from various sources, simplifying the data preparation process.
- Interactive Visualizations: It allows the creation of engaging dashboards and reports that can be easily shared, facilitating effective communication of insights.
- Real-time Updates: Dashboards and reports update automatically as new data flows in, keeping insights timely and relevant.
- Cross-platform: Dashboards and visualizations are easily viewable on desktop, tablet, and mobile devices.
- Built-in AI: Features like AI-driven insights and forecasting enhance analytical depth without requiring specialized expertise.
- Secure Integration: Securely connects with both cloud-based and on-premises data sources, ensuring data security and flexibility.
- Natural Language Queries: Allows users to explore data simply by asking questions in plain language, making data analytics accessible to everyone.
- Templates and SaaS Integration: Pre-built templates and easy integration with SaaS platforms streamline and speed up report creation.
- Hybrid Deployment: Supports flexible deployment models, accommodating hybrid (cloud and on-premises) environments seamlessly.
Practical interview tip: Avoid simply listing features without context. Interviewers are usually looking for your understanding of how these advantages translate into better business outcomes, like improved decision-making or faster reporting.
3. What are some disadvantages of Power BI?
|
What the interviewer wants to know:
They're assessing your understanding of Power BI’s limitations and whether you're realistic about the tool's capabilities and trade-offs. |
How to approach answering:
Be honest and balanced. Clearly outline key limitations but demonstrate your knowledge by briefly mentioning how users typically manage or mitigate these limitations in practice. |
How you might respond:
While Power BI is extremely powerful and widely adopted, it does come with certain limitations:
- Not always intuitive: While user-friendly overall, some advanced features can be challenging for beginners, requiring additional learning.
- Data limitations: The free version restricts dataset sizes to 1 GB, limiting its use for larger datasets without upgrading to a paid version.
- Real-time constraints: Not all data sources offer seamless real-time connections, requiring extra steps or configurations.
- Filter persistence: Filters adjusted by users can't be permanently saved within visual reports, which can be inconvenient when revisiting dashboards.
- Licensing restrictions: Access to features like increased data storage, frequent refresh cycles, and collaborative sharing typically requires a Power BI Pro or Premium subscription.
Practical interview tip: Avoid sounding overly negative or dismissive about these disadvantages. Interviewers appreciate balanced answers, so briefly mentioning how you've overcome (or might overcome) these limitations in real-world scenarios can effectively demonstrate your practical understanding and problem-solving skills.
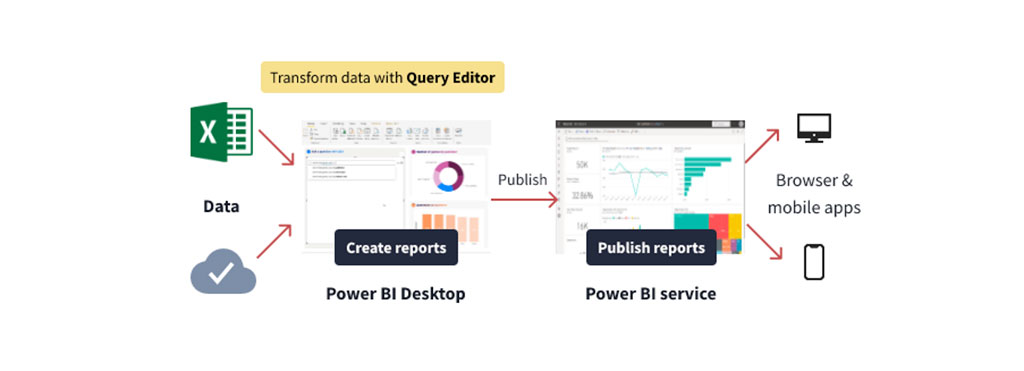
4. What are the steps in a standard Power BI workflow?
|
What the interviewer wants to know:
They're assessing whether you understand the full workflow of using Power BI, from data collection through sharing final insights. |
How to approach answering:
Clearly describe each step in the Power BI workflow, emphasizing your understanding of best practices at each stage. Highlight your familiarity with how each step contributes to delivering valuable insights. |
How you might respond:
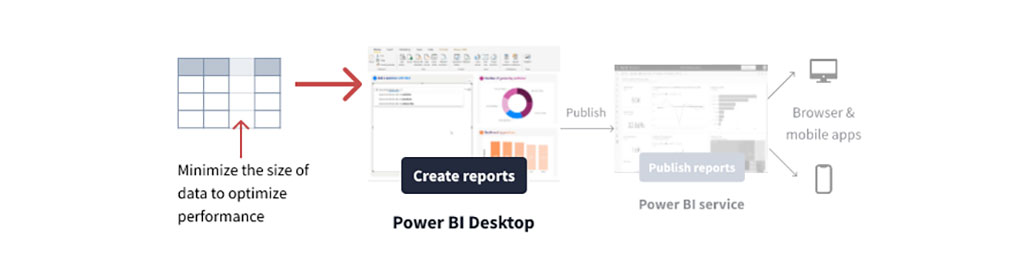
A typical Power BI workflow involves these core four steps:
- Data Collection and Preparation: Use Power BI Desktop to connect to and import data from various sources. Then clean, transform, and organize the data, ensuring accuracy and readiness for analysis.
- Creating Visualizations and Reports: Transform the prepared data into clear, meaningful visualizations and interactive reports that highlight key insights and patterns.
- Publishing to Power BI Service: Upload reports from Power BI Desktop to Power BI Service (cloud platform), and then build interactive dashboards by selecting key visuals from your reports.
- Sharing and Collaboration: Share published dashboards and reports securely with stakeholders, colleagues, or management via Power BI Service to foster informed decision-making and collaborative analysis.
Practical interview tip: When answering, briefly emphasizing collaboration—like how each step supports effective teamwork and informed decisions—can show the interviewer you understand not just the technical workflow, but also how Power BI helps businesses collaborate better through data.
5. What are the main business applications of Power BI?
|
What the interviewer wants to know:
They’re trying to gauge if you understand how businesses practically benefit from using Power BI, beyond just technical features. |
How to approach answering:
Highlight specific ways businesses commonly use Power BI to solve real-world challenges, make informed decisions, and improve overall performance. Keep your language straightforward and practical. |
How you might respond:
Businesses use Power BI in tons of different ways, but some of the most valuable applications I've seen include:
- Business performance monitoring: Teams track KPIs, departmental goals, and project statuses through interactive dashboards, helping everyone see exactly how things are going in real-time.
- Decision-making and strategy: By turning raw data into clear, visual insights, leaders can quickly see what's working, spot risks or opportunities, and make better-informed decisions.
- Customer insights with AI: Companies use Power BI’s built-in AI capabilities to understand customer behavior, predict trends, and improve customer satisfaction; this makes marketing and sales efforts smarter.
- Financial analytics and forecasting: Businesses analyze financial data, manage budgets, and forecast future outcomes easily, thanks to Power BI's intuitive forecasting tools and automated analytics.
- Collaboration and transparency: Power BI dashboards can be securely shared with team members based on their roles, helping everyone easily access exactly the information they need without confusion or delays.
- External reporting and engagement: Many organizations embed attractive and interactive Power BI visuals directly into websites or apps, clearly showcasing their performance or products to customers and stakeholders.
Practical interview tip: To impress interviewers, avoid simply listing these applications. By briefly mentioning a specific scenario or example from your experience (or research), you can clearly demonstrate your practical understanding of Power BI’s real-world value.
6. What kind of specialists typically use Power BI?
|
What the interviewer wants to know:
They're checking if you understand who typically works with Power BI, and whether you recognize how broadly applicable the tool is across different job roles. |
How to approach answering:
Highlight common professional roles that utilize Power BI, briefly explaining why each role benefits from it. Be clear, practical, and straightforward. |
How you might respond:
Power BI is popular across various roles, especially those responsible for analyzing data and making decisions based on it. You’ll commonly see it used by:
- Business Analysts: To quickly identify business trends, spot opportunities, and present insights clearly to stakeholders.
- Data Analysts: To efficiently analyze and visualize complex datasets, simplifying the discovery of actionable insights and trends.
- Project Managers: They use dashboards to monitor project progress, spot bottlenecks, and keep teams aligned on KPIs and timelines.
- Data Scientists: While they often use specialized analytical tools, data scientists also leverage Power BI for sharing results, especially when communicating complex models to non-technical stakeholders.
- Marketing Specialists: They use it to quickly visualize customer data, track campaign performance, and adjust strategies based on clear, real-time feedback.
- Finance Professionals: Frequently rely on Power BI to perform budget analysis, financial forecasting, and generate visual reports for stakeholders.
- Executives and Managers: Many senior leaders prefer Power BI’s simplicity and real-time visualizations to stay updated on organizational performance and make informed strategic decisions.
Practical interview tip: A common mistake is to focus only on technical or analytical roles. Mentioning how non-technical professionals, like managers or marketers, also benefit from Power BI clearly demonstrates to interviewers that you understand its broad relevance across an organization.

7. What is a dashboard in Power BI?
|
What the interviewer wants to know:
They're checking your understanding of dashboards in Power BI, specifically what they are, why they’re valuable, and how effectively you can explain this to others. |
How to approach answering:
Keep your answer clear and straightforward. Briefly describe what a dashboard is, highlight its purpose in simplifying complex information, and mention why businesses find dashboards especially useful. |
How you might respond:
A dashboard in Power BI is basically a one-page summary that shows the most important visuals from your reports—like charts, graphs, or key metrics—in a single, easy-to-understand view. Dashboards help users quickly see what's going on in the business, spot trends, and identify issues without having to dig into multiple reports or spreadsheets. They're also interactive, so users can click visuals to explore more details. Another great thing about Power BI dashboards is that they work well on any device, so managers or team members can stay informed wherever they are.
Practical interview tip: When sharing your own answer in an interview, try mentioning a specific example where you created or used a dashboard to quickly solve a real business problem. Interviewers always appreciate candidates who illustrate their points with practical experience.
8. What is Power BI Desktop?
|
What the interviewer wants to know:
They’re checking if you're familiar with Power BI Desktop, understand its core functions, and can clearly explain its role within the broader Power BI workflow. |
How to approach answering:
Clearly describe Power BI Desktop, focusing on what it does, why it's useful, and how it fits into creating reports and dashboards. Avoid unnecessary technical jargon and keep it practical. |
How you might respond:
Power BI Desktop is the main application I use for working with Power BI. It's an all-in-one workspace where I can connect to data, clean it, build data models, and create visuals and interactive reports from scratch. Beyond just cleaning data, Desktop lets me model relationships between datasets, build custom formulas with DAX, and design polished reports that I can publish directly to Power BI Service. It brings together all the key Power BI features in a single, easy-to-use desktop interface.
Practical interview tip: To add extra value to your answer, you could briefly highlight how Power BI Desktop’s ease-of-use or free availability specifically helped you or your team solve a challenge quickly or overcome a limitation of another tool you've used previously.
9. What is Power Query?
|
What the interviewer wants to know:
They're checking your understanding of Power Query, specifically what it does, why it's useful, and if you’re familiar with how it fits into the data preparation process in Power BI. |
How to approach answering:
Clearly define Power Query, mention the specific tasks it helps users accomplish, and briefly explain its role in simplifying data preparation for analysis. |
How you might respond:
Power Query is a built-in tool available in Power BI Desktop that makes it easy to connect to data from almost any source—like Excel spreadsheets, CSV files, databases such as SQL or Oracle, or even data from the web or social media. Once connected, you can quickly clean, reshape, and transform your data, getting it ready for analysis without needing complicated coding. It’s super user-friendly, with a simple, visual interface, though if you prefer, you can dive deeper and edit or write your own queries using its built-in 'M' language. Basically, Power Query saves tons of time by automating tedious data prep tasks.
Practical interview tip: Interviewers love to hear examples, so it can help if you briefly mention a specific way you've used Power Query (e.g., combining data from multiple messy sources) to show your practical experience.
10. What is Power Pivot?
|
What the interviewer wants to know:
They're evaluating your understanding of Power Pivot, specifically its role within Power BI, and whether you grasp its importance for data modeling and analytics tasks. |
How to approach answering:
Clearly define Power Pivot, highlight its key features, and briefly explain why it's valuable specifically within Power BI (not just Excel). Emphasize its practical role in data modeling and analysis. |
How you might respond:
Power Pivot is a data modeling component built into Power BI (and originally available in Excel) that allows you to create sophisticated data models from multiple sources. It lets you define relationships between tables, perform powerful calculations using the Data Analysis Expressions (DAX) language, and build measures or calculated columns. By compressing large datasets, Power Pivot helps Power BI handle more complex data efficiently, making your reports faster and easier to navigate, even when dealing with millions of rows of data. It's a critical tool in Power BI because it lets you build robust, flexible models that drive interactive and insightful reports.
Practical interview tip: Interviewers may specifically listen to hear you mention DAX, relationships, or data modeling capabilities. Highlighting your familiarity with these concepts can clearly demonstrate your technical understanding of Power Pivot's role within Power BI.
Power BI Interview Questions: Structure and Components
In this next section, you'll learn how to answer questions about Power BI's structure, components, and key terminology. While these questions might seem basic, interviewers often use terms such as "building blocks," "components," "views," or "elements" in ways that can feel ambiguous or confusing. If you're ever unsure exactly what an interviewer means by a specific term, it's perfectly acceptable (and even recommended!) to politely ask for clarification.
For example, you might say:
When you mention 'components,' are you referring to the main applications that make up Power BI, or specific features within those applications?
Asking for clarification shows professionalism, builds confidence, and ensures you're answering exactly what the interviewer wants to know.
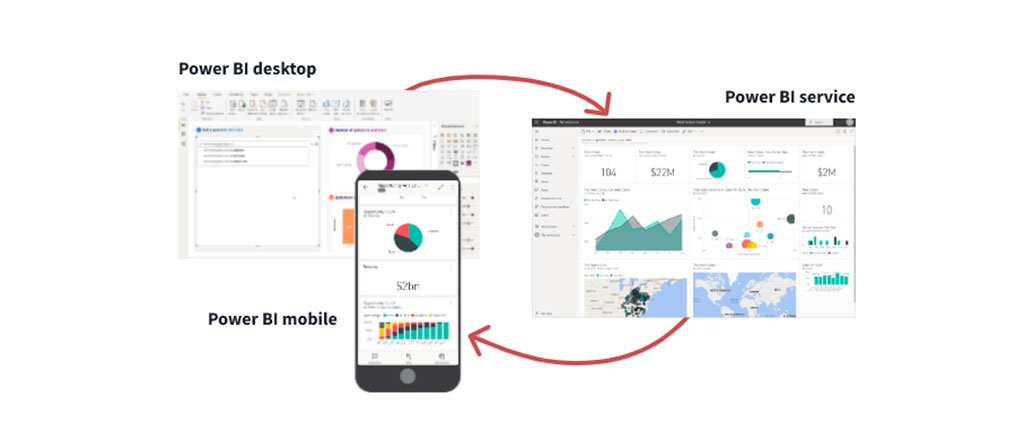
11. What are the main elements of the Power BI package?
|
What the interviewer wants to know:
They’re checking whether you understand the core elements of Power BI and how clearly you can distinguish their roles and relationships. |
How to approach answering:
Identify and briefly describe each main element clearly—highlighting the unique role each plays within the Power BI ecosystem. Mention the practical value of each element to demonstrate your understanding. |
How you might respond:
Power BI primarily consists of three core elements:
- Power BI Desktop: A free desktop app for connecting to data, transforming it, and creating interactive reports and visualizations.
- Power BI Service: A cloud-based service that lets you publish your reports online, allowing teams to access dashboards, share insights securely, and collaborate easily.
- Power BI Mobile Apps: These let users view and interact with Power BI reports on their phones or tablets, making insights available anytime, anywhere.
Practical interview tip: If the interviewer seems like they were expecting more elements beyond these three, you may want to proactively ask a clarifying question. For example, "When you ask about 'elements,' are you also looking for details on additional components such as Power BI Report Server, Power BI Embedded, or built-in tools like Power Query and Power Pivot?" Asking this upfront demonstrates your deeper understanding of Power BI and helps you deliver exactly the information the interviewer wants.
12. What are the building blocks of Power BI?
|
What the interviewer wants to know:
They're assessing your foundational knowledge of how Power BI organizes data and visuals, ensuring you understand the basic components essential to using the tool effectively. |
How to approach answering:
Briefly define each building block clearly and practically, emphasizing how they fit together to form the full Power BI experience, from raw data to final insights. |
How you might respond:
Everything you do in Power BI is built from these key building blocks:
- Visualizations: These are the visuals that clearly communicate insights from your data. Examples include bar charts, pie charts, line graphs, or even maps that highlight sales performance geographically.
- Datasets: Collections of data gathered from various sources, such as Excel spreadsheets, CSV files, databases, or cloud services. Datasets are the foundation you use to create reports and visualizations.
- Reports: These are pages that combine multiple related visuals to clearly tell a data-driven story. For instance, you might create a detailed sales performance report or a marketing campaign analysis.
- Dashboards: Dashboards are simplified one-page summaries that highlight the most important visuals from one or more reports. They provide quick insights at a glance, allowing stakeholders to easily track key metrics and business performance.
- Tiles: Individual visuals on a dashboard or report, such as a single bar chart or a KPI card. Each tile conveys a specific insight or piece of information clearly and concisely.
Practical interview tip: Interviewers often expect candidates to explain how these building blocks relate to each other, so be sure to briefly illustrate their relationships. For example: datasets feed into reports → reports feed into dashboards → dashboards consist of individual tiles that users interact with.
13. What are the main components of the Power BI toolkit?
|
What the interviewer wants to know:
They’re checking if you clearly understand the individual tools included within Power BI, their specific purposes, and how they help users achieve practical goals. |
How to approach answering:
Briefly define each main component of the Power BI toolkit, mentioning its purpose clearly and practically. This shows that you're familiar with how each component uniquely adds value. |
How you might respond:
The main components of the Power BI toolkit include:
- Power Query: Helps you easily connect to multiple data sources, clean and transform raw data, and prepare it for analysis.
- Power Pivot: Allows you to create advanced data models, define relationships between datasets, and perform powerful calculations using the DAX language.
- Power Map: Lets you create visually engaging 3D maps, making it easier to analyze and communicate location-based or geographic data clearly.
- Power Q&A: A feature that lets users ask natural-language questions directly about their data and receive instant, intuitive visual answers without complex queries.
- Power View: Enables you to build interactive visuals quickly (e.g., charts, graphs, and maps) so users can easily explore and interpret data.
Practical interview tip: Be careful not to just list these components without context. Interviewers often want to see that you know not only what each tool does, but also why it matters to a business user. Quickly connecting each component to a practical business scenario will strengthen your answer significantly.
14. What are the different connectivity modes in Power BI?
|
What the interviewer wants to know:
They want to confirm you understand the different ways Power BI connects to data sources, including the trade-offs and use cases of each mode. |
How to approach answering:
Briefly describe each connectivity mode, clearly mentioning key differences, benefits, and limitations to show your practical understanding. |
How you might respond:
Power BI has three connectivity modes:
- Import Mode (SQL Server Import): The default and most common mode. Data is imported directly into Power BI Desktop, allowing quick performance and advanced data manipulation. However, without a premium license, you can't import datasets larger than 1 GB.
- Direct Query Mode: Instead of importing data, Power BI connects directly to the data source, retrieving data only when needed. This mode works well for large datasets or real-time scenarios but has limitations on certain data transformations and operations.
- Live Connection Mode: Similar to Direct Query, Power BI doesn't store data internally. Instead, it directly queries a data source each time you interact with visuals. This mode supports only specific sources: SQL Server Analysis Services, Azure Analysis Services, and Power BI Datasets.
Practical interview tip: Interviewers often look for your ability to explain trade-offs, so make sure you briefly mention practical scenarios for choosing one mode over the others. For example, mentioning why Import Mode suits smaller datasets while Direct Query or Live Connection might be necessary for larger or frequently changing data.

15. What types of data sources can Power BI connect to?
|
What the interviewer wants to know:
They're checking your familiarity with the wide range of data sources Power BI can connect to, and whether you understand how flexible and versatile it is in practical use. |
How to approach answering:
Clearly categorize the types of data sources Power BI supports, providing practical examples that reflect real-world use cases. Keep your language straightforward and relatable. |
How you might respond:
Power BI can connect to many different types of data sources, making it incredibly flexible. The main categories include:
- Files and spreadsheets: Commonly used sources like Excel files, CSV files, or other document formats that businesses frequently rely on for day-to-day operations.
- Databases and cloud services: Includes popular databases like SQL Server, Azure SQL, or Oracle, as well as cloud services like Azure Analysis Services or cloud-based datasets.
- Content packs and online services: These include pre-built data packs shared by service providers (like Salesforce or Google Analytics) or content shared by colleagues within your organization, making setup fast and straightforward.
- Web and online data: Power BI also connects directly to web-based sources, letting you analyze and visualize data from APIs, social media, or web analytics platforms.
Practical interview tip: One common mistake is mentioning only databases or Excel files as sources. Be sure to highlight at least one cloud-based or web-based example to demonstrate you're aware of Power BI’s versatility; this is something many interviewers specifically look for.
16. What are the different views in the Power BI Desktop?
|
What the interviewer wants to know:
They're checking your familiarity with the Power BI Desktop interface, ensuring you understand each view's purpose and practical use. |
How to approach answering:
Clearly describe each view available in Power BI Desktop, highlighting their unique roles in the workflow: report creation, data modeling, and data exploration. |
How you might respond:
Power BI Desktop has three main views, each designed for a specific task:
- Report View: This is the default workspace, where you actually build your visualizations and interactive reports. It's where most users spend the majority of their time, designing visuals, formatting reports, and getting everything ready to publish.
- Data View: Here, you can see your data clearly organized into tables. It's useful for performing data transformations, reviewing the data you've imported, and creating calculated columns or measures using the DAX language.
- Model View (also called Relationship View): In this view, you manage how your data tables relate to each other. You can set or adjust relationships between different tables, helping ensure your data model works correctly and efficiently supports your visualizations.
Practical interview tip: A common mistake candidates make is mixing up the Data View and Model View. Clearly distinguishing their uses will show interviewers you've got a solid grasp of Power BI Desktop’s workflow.
Power BI Interview Questions: Advanced Concepts
In this final section, we'll learn how to answer more advanced Power BI interview questions—ideal if you're aiming for senior-level roles or positions requiring deeper technical knowledge. These questions often explore concepts such as data storage, advanced data modeling, specialized query languages (DAX and M), and self-service business intelligence. If some of these terms or concepts feel less familiar, don't panic! We'll clarify exactly what interviewers expect, guide you through the best approach for answering, and ensure you're confidently prepared.
17. Where is the data stored in Power BI?
|
What the interviewer wants to know:
They're checking your technical understanding of how Power BI manages and secures data, particularly in cloud-based storage. |
How to approach answering:
Provide a clear, concise explanation of where Power BI data and metadata are stored, emphasizing security and protection methods. Demonstrating awareness of security practices is valuable here. |
How you might respond:
Power BI primarily stores data in two secure locations within the Microsoft Azure environment:
- Azure Blob Storage: This is where your actual data (the content you upload or import) is securely stored.
- Azure SQL Database: This stores all metadata, system configurations, and artifacts related to Power BI, like data models and report definitions.
All data stored in Power BI is protected through encryption and secure access controls, ensuring business information remains safe at all times.
Practical interview tip: A common pitfall here is overcomplicating your answer. Interviewers typically look for a clear demonstration that you understand data storage basics and security measures. Keep it simple and clear, and reassure them you're familiar with the secure nature of Microsoft's cloud-based storage solutions.
Date column. This will ensure that the granularity is the same between your different tables.18. What is the difference between Power BI and Tableau?
|
What the interviewer wants to know:
They're testing your knowledge of the business intelligence tools landscape, particularly your ability to compare and contrast Power BI with its biggest competitor, Tableau. |
How to approach answering:
Provide a clear, balanced comparison of key differences between Power BI and Tableau. Focus on practical distinctions, such as pricing, functionality, ease of use, and typical business scenarios. |
How you might respond:
Both Power BI and Tableau are powerful BI tools used for analyzing data and creating visualizations, but there are a few key differences:
- Cost: Power BI is generally more affordable, making it a good option for smaller businesses or budget-conscious teams. Tableau tends to be pricier, but some enterprises prefer it for its advanced visualization capabilities.
- Formulas and queries: Power BI primarily uses the DAX language, which is familiar to users who know Excel. Tableau mainly relies on MDX, a language focused on multidimensional data queries.
- Visual capabilities: Tableau is known for its highly customizable, advanced visualizations, making it popular among data visualization specialists. Power BI also creates great visuals, but it shines particularly in creating straightforward, intuitive reports and dashboards quickly.
- Data connectivity: Both tools connect to many data sources, but Tableau has traditionally supported a wider variety of data connections. However, Power BI's connectivity options have expanded significantly in recent years.
- Learning curve: Power BI tends to be easier for beginners or business users to learn because of its similarity to Microsoft Excel. Tableau has a steeper learning curve but offers greater flexibility for advanced visual analytics.
Practical interview tip: One pitfall to avoid when answering this question is sounding biased toward one tool. Interviewers appreciate candidates who understand each tool’s strengths and weaknesses objectively, so emphasize how your knowledge of these differences can help a business choose the right tool based on its needs.
19. What is the M language in Power BI?
|
What the interviewer wants to know:
They’re checking your understanding of Power BI’s Power Query and your familiarity with the M language, including when and why you might use it. |
How to approach answering:
Clearly define the M language, explain its role within Power Query, and briefly highlight practical tasks you’d typically accomplish with it. Avoid overly technical details unless specifically asked. |
How you might respond:
The M language (also called M-Code) is a scripting language used within Power Query in Power BI. It's what’s behind the scenes when you're connecting, cleaning, reshaping, and combining data from different sources. While the Power Query Editor interface allows you to perform most of these tasks visually, knowing M-code lets you fine-tune transformations, automate data-cleaning steps, or handle more complex scenarios. It's especially helpful if you need greater control or precision than what the graphical interface offers.
Practical interview tip: A common issue candidates run into is making M-code sound overly technical or complicated. Instead, clearly emphasize that while M-code is powerful, it's often optional; most tasks can be done visually. Understanding M just gives you an extra edge in tackling more advanced data-prep challenges.
20. What is DAX in Power BI?
|
What the interviewer wants to know:
They're assessing whether you clearly understand what DAX is, its role in Power BI, and why it’s important for data analysis and reporting. |
How to approach answering:
Clearly define DAX, mention its practical use in Power BI, and highlight some common scenarios or tasks that you can accomplish using DAX. |
How you might respond:
DAX (Data Analysis Expressions) is a powerful formula language used within Power BI to create custom calculations, measures, and calculated columns in data models. I think of it as similar to Excel formulas, but specifically designed for Power BI’s data models. With DAX, I can perform advanced analytics, like creating custom metrics, calculating year-over-year growth, or filtering data dynamically. It's also great for building measures that can instantly adapt to different user interactions on my reports and dashboards.
Practical interview tip: Interviewers often want to see that you understand the practical value of DAX rather than just its technical details, so avoid just listing data types or functions. Instead, briefly describe one or two real-world examples of useful measures you've built or seen, demonstrating your practical understanding.
21. What does self-service business intelligence (SSBI) mean?
|
What the interviewer wants to know:
They want to see if you understand the concept of self-service BI and its practical benefits to organizations, especially in terms of empowering users. |
How to approach answering:
Define SSBI clearly and briefly describe how it benefits organizations by making data analysis accessible to non-technical users. |
How you might respond:
Self-service business intelligence (SSBI) is an approach that allows people across an organization—not just technical experts—to independently access, analyze, and visualize data without relying heavily on IT or specialized analysts. With SSBI tools, I can easily connect to data sources, create reports, and draw insights on my own, without always needing help from a dedicated analyst or developer. This approach speeds things up, reduces bottlenecks, and helps teams make better, faster decisions because the people who know the business best can explore and interpret data directly.
Practical interview tip: Interviewers sometimes test whether you understand not just what SSBI is, but also its strategic value. So it's helpful to mention practical benefits like increased speed, improved decision-making, or greater empowerment of non-technical teams rather than simply repeating the definition.
22. What are content packs in Power BI?
|
What the interviewer wants to know:
They’re checking your understanding of content packs, specifically how they simplify collaboration and sharing in Power BI. |
How to approach answering:
Define content packs simply, provide examples, and emphasize their practical value for businesses in terms of ease of sharing and collaboration. |
How you might respond:
A content pack in Power BI is a bundle of related dashboards, reports, and datasets packaged together, making it super easy to share insights within a team or across the organization. There are typically two types: service provider content packs, which are pre-built by external services like Salesforce or Google Analytics, and organizational content packs created internally within your company. For example, I might create a marketing content pack with reports and dashboards showing the results of recent campaigns, then share it with my entire marketing team so everyone can quickly access the same consistent insights. It's a simple way to ensure everyone stays on the same page.
Practical interview tip: A common mistake is not clearly differentiating between content packs and other types of sharing options, like apps or direct report sharing. If the interviewer seems interested in how content packs differ from these other methods, clarifying these distinctions briefly can highlight your deeper knowledge of Power BI’s collaboration capabilities.
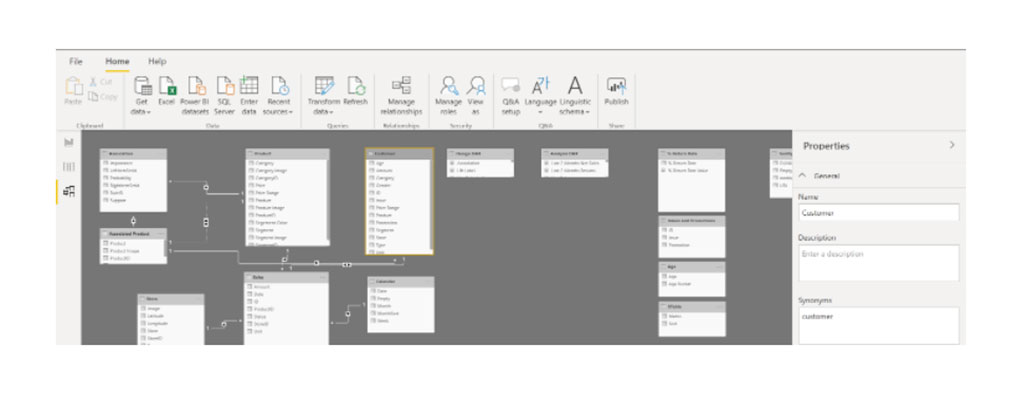
23. How can we define the relationships between two tables in a data model in the Power BI Desktop?
|
What the interviewer wants to know:
They want to ensure you understand how relationships between tables work in Power BI Desktop, and whether you can clearly explain both the manual and automatic approaches. |
How to approach answering:
Briefly describe the two main ways to create table relationships, highlighting practical considerations for each. |
How you might respond:
In Power BI Desktop, I can define relationships between two tables in one of two ways:
- Manual relationships: I manually create a relationship by dragging and connecting fields (usually primary and foreign keys) from one table to another in the Model View. This gives me precise control over my data model.
- Automatic relationships: Power BI automatically detects and creates relationships if the autodetect feature is enabled. While convenient, I usually double-check these relationships to make sure they're correct.
It's important to make sure there are no duplicates or null values in the key columns I'm using; otherwise, the relationships won't work properly. Also, Power BI lets me define multiple relationships between the same two tables, but only one can be active at any given time. The active relationship is shown with a solid line, while inactive ones have dotted lines.
Practical interview tip: A frequent interview "oops" is forgetting to mention practical considerations like duplicates, null values, or active vs. inactive relationships. Making sure you include these details clearly shows the interviewer you understand not only how relationships work but also what could cause problems when creating them.
24. What are the different refresh options in Power BI?
|
What the interviewer wants to know:
They’re assessing your understanding of the different refresh mechanisms in Power BI and how clearly you can explain their specific uses and differences. |
How to approach answering:
Briefly describe each refresh option clearly, highlighting practical scenarios or examples that show when each option is used. |
How you might respond:
Power BI has four main refresh options, each used for a specific purpose:
- Package refresh: Synchronizes Power BI Desktop files stored in OneDrive or SharePoint Online with Power BI Service. It doesn't refresh the underlying data, it just keeps your reports up-to-date with any changes you made in the desktop file itself.
- Model refresh (or Data refresh): Updates the actual data within your dataset by pulling fresh data from the original sources, like databases or cloud services. This is typically scheduled regularly (like daily or weekly) to keep your reports current.
- Tile refresh: Automatically refreshes the individual visuals (tiles) on a dashboard approximately every 15 minutes or whenever underlying data changes. You can also manually force this refresh to ensure the latest insights are shown immediately.
- Visual container refresh: Updates cached visuals within your reports when data changes, ensuring anyone viewing the report sees accurate visuals reflecting the latest data.
Practical interview tip: Interviewers typically want to know you understand the practical reasons behind choosing a specific refresh option. A common mistake is describing these refresh options without context. So briefly mentioning a realistic business scenario for at least one refresh option can demonstrate your practical knowledge clearly.
25. What types of filters can we use in Power BI reports?
|
What the interviewer wants to know:
They're checking your understanding of how filters work in Power BI and whether you can clearly describe their practical application at different levels of a report. |
How to approach answering:
Clearly describe each filter type, explicitly mentioning their scope (report-level, page-level, visualization-level) and provide practical examples that reflect common business scenarios. |
How you might respond:
In Power BI, I typically use three main types of filters to control what data shows up in my reports:
- Report-level filters: These apply to every visual across all pages of the entire report. For example, I might use this to filter all visuals in a sales report to only show data from a specific region or time period.
- Page-level filters: These filters apply only to visuals on a particular page. So if I have a marketing dashboard with multiple pages, I might apply a filter just to the "Campaign Performance" page to show results only from my latest campaigns.
- Visualization-level filters: These affect just one specific visual. So, if I have a bar chart showing monthly revenue, I might use a visualization-level filter to focus that chart on just the top five performing products.
Practical interview tip: Interviewers often listen carefully for whether candidates clearly differentiate between these filter types. A common mistake candidates make is confusing visualization-level and page-level filters. Make sure your explanation clearly shows you understand exactly where and when each type of filter should be used.
Next Steps
In this article, we've covered the most common Power BI interview questions, and how to answer them effectively. Hopefully these explanations and examples have given you the clarity and confidence you need to ace your next interview.
If you'd like to brush up your Power BI skills before starting your job search, prepare for the PL-300 certification, or even start learning Power BI from scratch, we've got you covered.
If you want to learn Power BI through hands-on practice and build a solid Power BI projects portfolio, check out our Analyzing Data with Microsoft Power BI skill path. You'll use the complete Power BI interface directly in your browser, complete exercises, and create real-world projects.
If your goal is broader and you're aiming to become a fully job-ready business analyst in just a few months, our comprehensive Business Analyst with Power BI career path is ideal. You'll learn everything included in the skill path, plus additional essential skills like SQL querying, advanced Excel techniques, and foundational statistical analysis. By the end, you'll have built a robust project portfolio, you'll be ready for the PL-300 certification exam, and you'll feel confident about landing your first Power BI job.