Excel vs Python: How to Do Common Data Analysis Tasks
In this tutorial, we'll compare Excel and Python by looking at how to perform basic analysis tasks across both platforms.
Excel is the most commonly used data analysis software in the world. Why? It's easy to get the hang of and fairly powerful once you master it. In contrast, Python's reputation is that it's more difficult to use, though what you can do with it is once you've learned it is almost unlimited.
But how do these two data analysis tools actually compare? Their reputations don't really reflect reality. In this tutorial, we'll take a look at some common data analysis tasks to demonstrate how accessible Python data analysis can be.
This tutorial assumes you have an intermediate-level knowledge of Excel, including using formulas and pivot tables. Feel free to check out our Excel Cheat Sheet before we get started.
We'll be using the Python library pandas, which is designed facilitate data analysis in Python, but you don't need any Python or pandas knowledge for this tutorial.
Why Use Python vs Excel?
Before we start, you might be wondering why Python is even worth considering. Why couldn't you just keep using Excel?
Even though Excel is great, there are some areas that make a programming language like Python better for certain types of data analysis. Here are some reasons from our post 9 Reasons Excel Users Should Consider Learning Programming:
- You can read and work with almost any kind of data.
- Automated and repetitive tasks are easier.
- Working with large data sets is much faster and easier.
- It's easier for others to reproduce and audit your work.
- Finding and fixing errors is easier.
- Python is open source, so you can see what's behind the libraries you use.
- Advanced statistics and machine learning capabilities.
- Advanced data visualization capabilities.
- Cross-platform stability — your analysis can be run on any computer.
To be clear, we don't advocate leaving Excel behind - it's a powerful tool with many uses! But as an Excel user, being able to also leverage the power of Python can save you hours of time and open up career advancement opportunities.
It's worth remembering the two tools can work well in tandem, and you may find that some tasks are best left in Excel, while others would benefit from the power, flexibility, and transparency that's offered by Python.
Importing Our Data
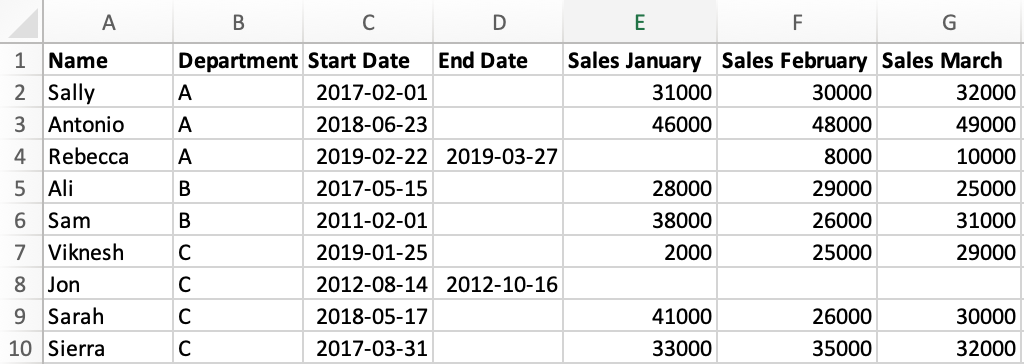
Let's start by familiarizing ourselves with the data we'll be working with for this tutorial. We'll use fictional data about a company with salespeople. Here's what our data looks like in Excel:
Our data is saved as a CSV file called sales.csv. In order to import our data in pandas, we need to start by importing the pandas library itself.
import pandas as pdThe code above imports pandas and aliases it to the syntax pd. That may sound complicated, but it's actually just a kind of nickname — it means that in the future we can just use pd to refer to pandas so that we don't have to type out the full word each time.
To read our file we use pd.read_csv():
sales = pd.read_csv('sales.csv')
salesWe assigned the result of pd.read_csv() to a variable called sales, which we'll use to refer to our data. We also put the variable name on its own in the last line of our code, which prints the data in a nicely formatted table.
Immediately, we can notice a few differences between how pandas represents the data vs what we saw in Excel:
- In pandas, the row numbers start at 0 versus 1 in Excel.
- The column names in pandas are taken from the data, versus Excel where columns are labelled using letters.
- Where there is a missing value in the original data, pandas has the placeholder
NaNwhich indicates that the value is missing, or null. - The sales data has a decimal point added to each value, because pandas stores numeric values that include null (
NaN) values as numeric type known as float (this doesn't effect anything for us, but we just wanted to explain why this is).
Before we learn our first pandas operation, we'll quickly learn a little about how our data is stored.
Let's use the type() function to look at the type of our sales variable:
type(sales)This output tells us that our sales variable is a DataFrame object, which is a specific type of object in pandas. Most of the time in pandas when we want to modify a dataframe, we'll use special syntax called a dataframe method, which allows us to access specific functionality that relates to the dataframe objects. We'll see an example of that in a moment when we complete our first task in pandas!
Sorting Data
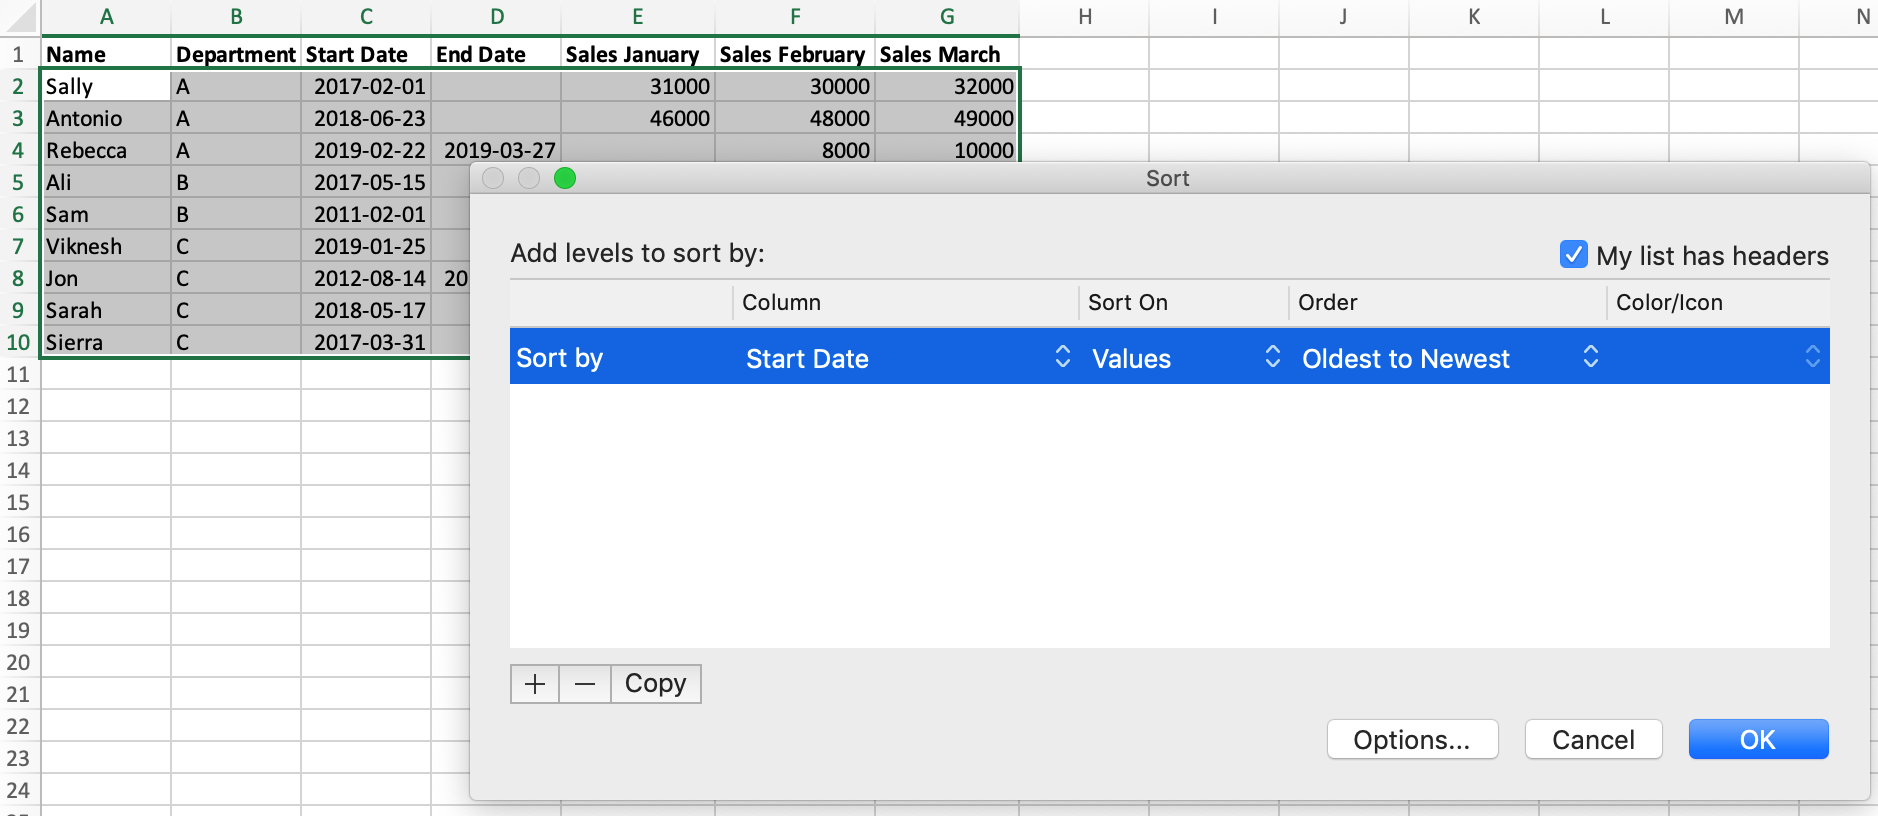
Let's learn how to sort our data in Excel and Python. Currently, our data isn't sorted. In Excel, if we wanted to sort our data by the "Start Date" column, we would:
- Select our data.
- Click the 'Sort' button on the toolbar.
- Select 'Start Date' in the dialog box that opens.
In pandas, we use the DataFrame.sort_values() method. We mentioned methods briefly a moment ago. In order to use them we have to replace DataFrame with the name of the dataframe we want to apply the method to — in this case sales. If you've worked with lists in Python, you will be familiar with this pattern from the list.append() method.
We provide the column name to the method to tell it which column to sort by:
sales = sales.sort_values("Start Date")
salesThe values in our dataframe have been sorted with one simple line of pandas code!
Summing the Sales Values
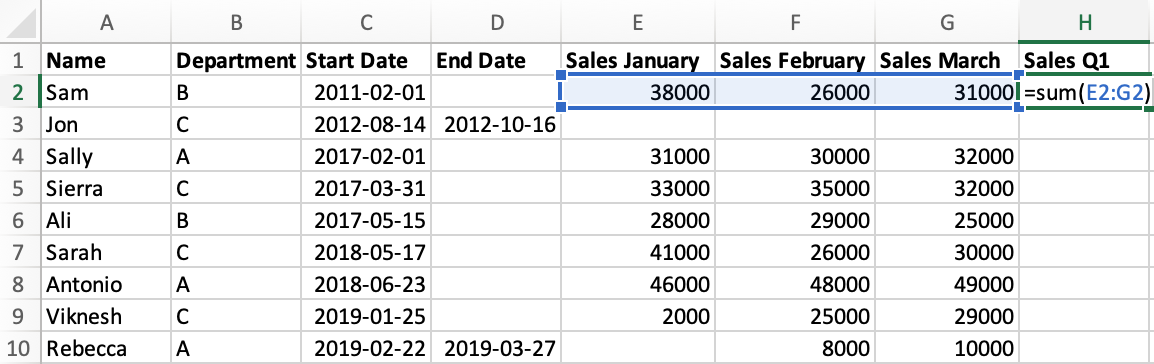
The last three columns of our data contain sales values for the first three months of the year, known as the first quarter. Our next task will be to sum those values in both Excel and Python.
Let's start by looking at how we achieve this in Excel:
- Enter a new column name
"Sales Q1"in cellH1. - In cell H2, use the
SUM()formula and specify the range of cells using their coordinates. - Drag the formula down to all rows.
In pandas, when we perform an operation it automatically applies it to every row at once. We'll start by selecting the three column by using their names in a list:
q1_columns = sales[["Sales January", "Sales February", "Sales March"]]
q1_columnsNext, we'll use the DataFrame.sum() method and specify axis=1, which tells pandas that we want to sum the rows and not the columns. We'll specify the new column name by providing it inside brackets:
sales["Sales Q1"] = q1_columns.sum(axis=1)
salesIn pandas, the "formula" we used isn't stored. Instead the resulting values are added directly to our dataframe. If we wanted to make an adjustment to the values in our new column, we'd need to write new code to do it.
Joining Manager Data
In our spreadsheet, we also have a small table of data on who manages each team:
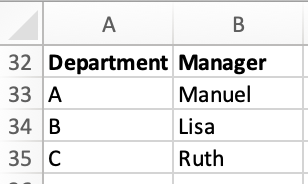
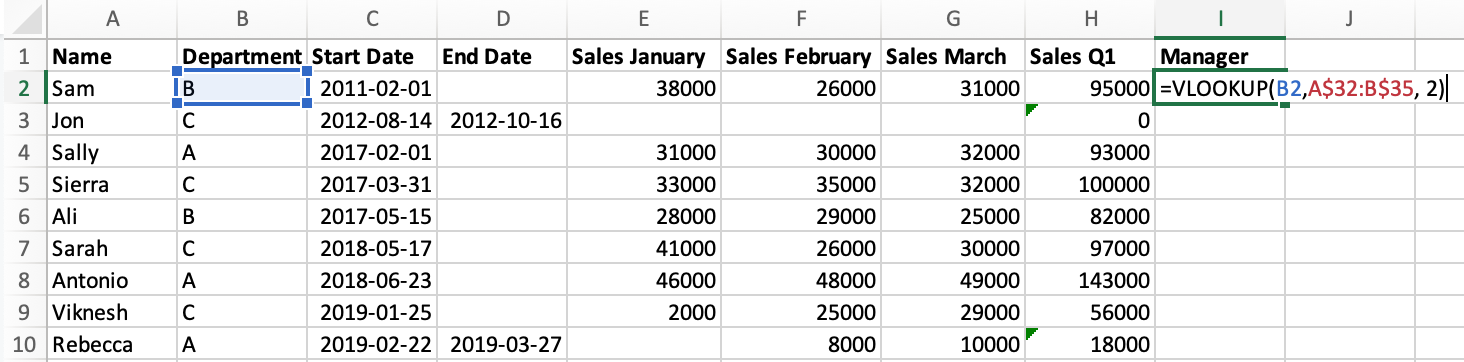
Let's look at how to join this data in a "Manager" column in Excel and Python. In Excel, we:
- start by adding the column name to cell
I1. - use the
VLOOKUP()formula in cellI2, specifying:- to lookup the value from cell
B2(the Department) - in the selection of manager data, which we specify using coordinates
- and that we want to select the value from the second column of that data.
- to lookup the value from cell
- Click and drag the formula down to all cells.
To work with this data in pandas, first we'll need to import it from a second CSV, managers.csv:
managers = pd.read_csv('managers.csv')
managersIn order to join mangers data to sales using pandas, we'll use the pandas.merge() function. We provide the following arguments, in order:
sales: the name of the first, or left, dataframe we want to mergemanagers: the name of the second, or right, dataframe we want to mergehow='left': the method we want to use to join the data. Theleftjoin specifies that no matter what, we want to keep all the rows from our left (first) dataframe.on='Department': The name of the column in both dataframes that we will join on.
sales = pd.merge(sales, managers, how='left', on='Department')
salesIf this seems is a bit confusing at first, that's OK. The model for joining data in Python is different to what is used in Excel, but it's also a lot more powerful. Note that in Python we get to specify exactly how we join our data using clear syntax and column names.
Adding a Conditional Column
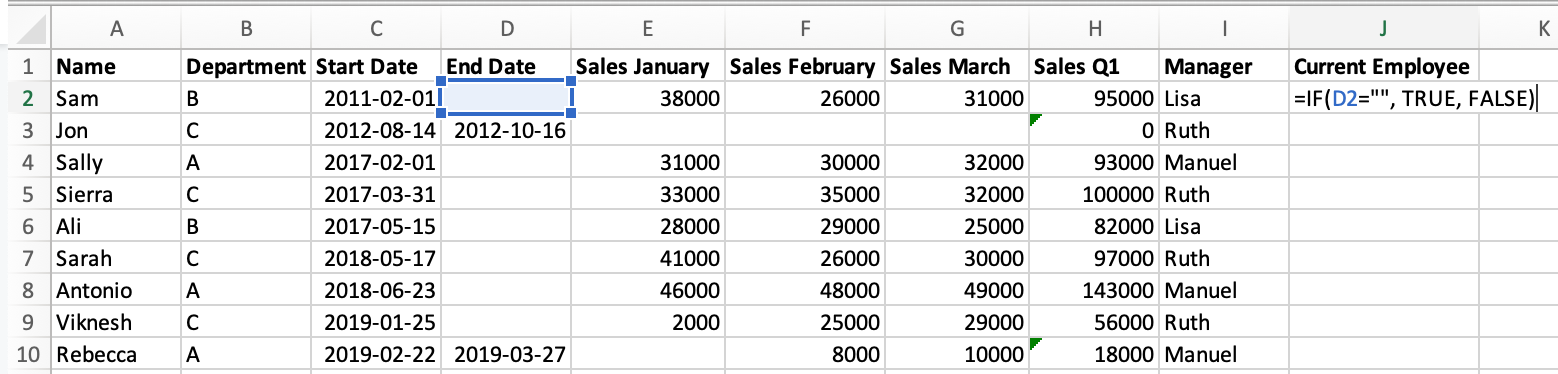
If we look at the "End Date" column, we can see that not all employees are still with the company — those with a missing value are still employed but the rest have left. Our next task will be to create a column which tells us if each salesperson is a current employee. We'll perform this in Excel and Python.
Starting with Excel, to add this column we:
- Add a new column name to cell
J1. - Use the
IF()formula to check if cellD1(End Date) is empty, and if so fillJ2withTRUE, otherwiseFALSE. - Drag the formula down to the cells below.
In pandas, we use the pandas.isnull() function to check for null values in the "End Date" column, and assign the result to a new column:
sales["Current Employee"] = pd.isnull(sales['End Date'])
salesPivot Tables
One of the most powerful Excel features is pivot tables, which facilitate data analysis using aggregation. We're going to look at two different pivot table applications in Excel and Python.
We'll start with a pivot table in Excel that counts the number of employees in each department:
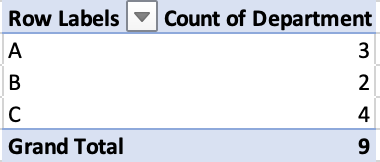
This operation — counting the number of times a value occurs in a column — is so common that in pandas it has its own syntax: Series.value_counts().
The series type is new to this tutorial, but it's quite similar to a DataFrame, which we've already learned about. Series is just the pandas representation of a single row or column.
Let's use the pandas method to calculate the number of employees in each department:
sales['Department'].value_counts()The second pivot table example also aggregates by department, but instead calculates the average Q1 sales:
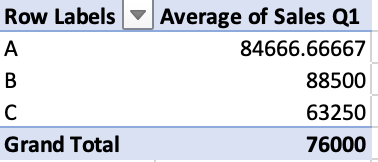
In order to calculate this in pandas, we'll use the DataFrame.pivot_table() method. We need to specify some arguments:
index: the column to aggregate by.values: the column we want to use the values for.aggfunc: the aggregation function we want to use, in this case'mean'average.
sales.pivot_table(index='Department', values='Sales Q1', aggfunc='mean')Excel vs Python: Summary
In this tutorial we learned Python equivalents for the following Excel functionality:
- Sorting data
SUM()VLOOKUP()IF()- Pivot Tables
For each example we looked at, the pandas syntax was of similar complexity to the formulas or menu options you would use in Excel. But Python offers some advantages, like much faster processing of large data sets, more customization and complexity, and more transparency for error-checking and auditing (since everything you've done is clearly laid out in code, rather than hidden in cells).
Someone proficient in Excel is more than capable of making the leap to working in Python. Adding Python skills to your skill set will make you a faster and more powerful analyst in the long run, and you'll discover new workflows that take advantage of both Excel and Python for more efficient and powerful data analysis than you could do with Excel alone.
If you'd like to learn how to analyze data in Python, our Data Analyst in Python path is design to teach you everything you need to know, even if you've never coded before. You'll start with two courses that teach you the Python fundamentals before you move onto learn the pandas library that we've worked with in this tutorial.