Turbocharge Your Data Acquisition using the data.world Python Library
When working with data, a key part of your workflow is finding and importing data sets. Being able to quickly locate data, understand it and combine it with other sources can be difficult.
One tool to help with this is data.world, where you can search for, copy, analyze, and download data sets. In addition, you can upload your data to data.world and use it to collaborate with others.
In this tutorial, we're going to show you how to use data.world's Python library to easily work with data from your python scripts or Jupyter notebooks. You'll need to create a free data.world account to view the data set and follow along.
The data.world python library allows you to bring data that's stored in a data.world data set straight into your workflow, without having to first download the data locally and transform it into a format you require.
Because data sets in data.world are stored in the format that the user originally uploaded them in, you often find great data sets that exist in a less than ideal, format, such as multiple sheets of an Excel workbook, where getting them into Python can be a pain. The data.world Python library takes this hassle away, allowing you to easily work with the data in your preferred form.
Installing the data.world library
The first thing you'll need to do is install the library, which you can do via pip:
pip install git+git://github.com/datadotworld/data.world-py.gitThis will install the library and all its dependent packages. One of the handy things about the library is its command line utility, which allows you to easily store your API token locally. This avoids having to put it in your scripts or notebook and have to worry about sharing your token when you share your work.
First, go to Settings > Advanced in data.world and get your API token:
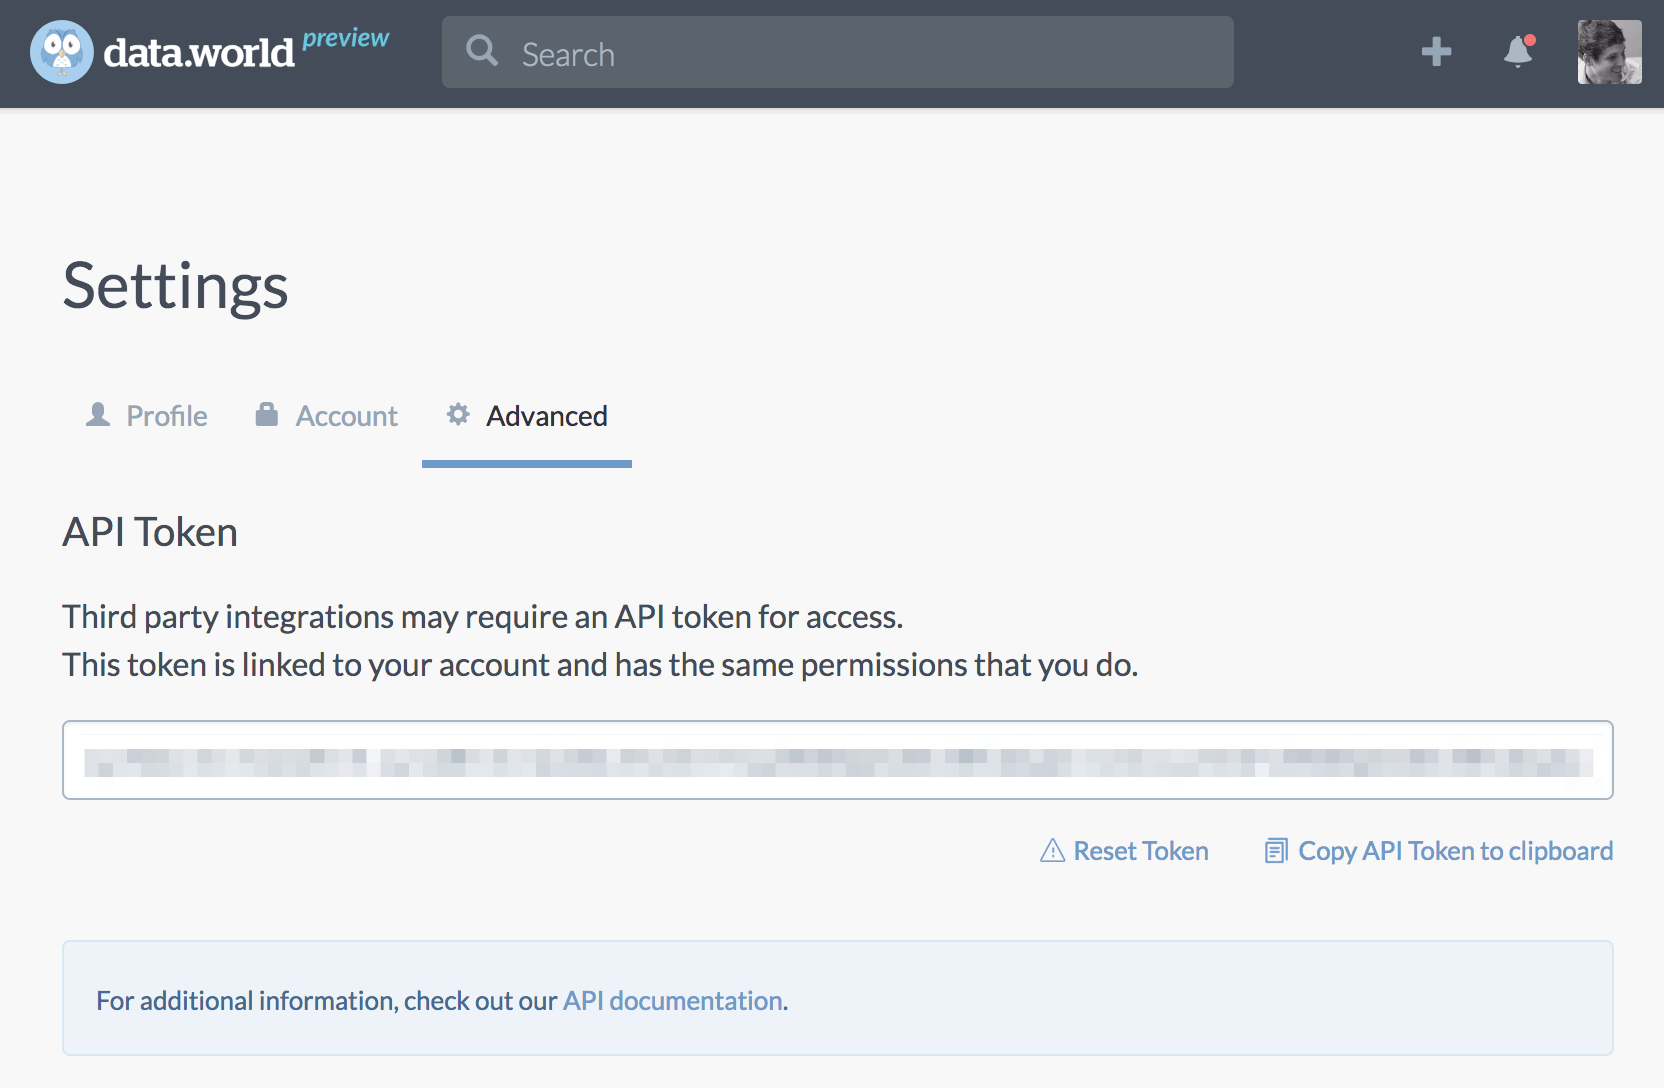
If you installed the python library in a virtualenv or Conda env, you will need to activate that environment. Then simply run dw configure, which will prompt you for your token:
~ (datadotworld) $ dw configure
API token (obtained at: https://data.world/settings/advanced): _
When you enter your token, a .dw/ directory will created in your home directory and your token will be stored there.
Our Data Set
For this tutorial, we'll be working with a data set of information on the TV show, The Simpsons. The dataset was scraped by Tod Schenider for his post The Simpsons by the Data, for which he made the scraper available on GitHub. Kaggle user William Cukierski used the scraper to upload the data set, which was then rehosted on data.world.
If you look at the data set page on data.world, you can see there are four csv files in the data set:
simpsons_characters.csv- Every character appearing in The Simpsons.simpsons_episodes.csv- Every episode of the The Simpsons.simpsons_locations.csv- Every location appearing in The Simpsons.simpsons_script_lines.csv- Each line from each script of the Simpsons.
We'll be working with this data using Python 3 and Jupyter Notebook.
Using data.world's Python library to explore the data
First, let's import the datadotworld library:
import datadotworld as dwWe're going to use the load_dataset() function to take a look at the data. When we use load_dataset() for the first time, it:
- Downloads the data set from data.world and caches it in our
~/.dw/directory - Returns a
LocalDatasetobject representing the data set
Caching the data set locally is a really neat feature - it allows for quicker subsequent loading, lets you work on the data offline, ensures that your source data is the same each time you run your code, and in the future will support data set versioning. After the first time you call load_data_set() for a given dataset, it will load the dataset from the cached version. You can pass True to the optional force_update parameter if you wish to force a reload from the remote version and overwrite the changes.
load_dataset() has one required parameter, dataset_key which you can extract from the URL of the data set on data.world. As an example, our simpsons data set has the URL https://data.world/data-society/the-simpsons-by-the-data, which makes its ID data-society/the-simpsons-by-the-data.
lds = dw.load_dataset('data-society/the-simpsons-by-the-data')Getting to know our data
To take a closer look at our LocalDataset object , we can use the LocalDataset.describe() method, which returns a JSON object.
# We use pprint as it makes our output easier to read
pp.pprint(lds.describe())
{
   'homepage': 'https://data.world/data-society/the-simpsons-by-the-data',
    'name': 'data-society_the-simpsons-by-the-data',
    'resources': [   {   'format': 'csv',
                         'name': 'simpsons_characters',
                         'path': 'data/simpsons_characters.csv'},
                     {   'format': 'csv',
                         'name': 'simpsons_episodes',
                         'path': 'data/simpsons_episodes.csv'},
                     {   'format': 'csv',
                         'name': 'simpsons_locations',
                         'path': 'data/simpsons_locations.csv'},
                     {   'format': 'csv',
                         'name': 'simpsons_script_lines',
                         'path': 'data/simpsons_script_lines.csv'}]}
Our JSON object has three key/value pairs at the top level: homepage, name, and resources. resources is a list that contains information about each file in our data.world data set: its name, format, and path. In the example above we can see that all four resources in this data set are CSV files.
Along with the LocalDataset.describe() function, there are three key attributes of our LocalDataset object which we can use to access the data itself: LocalDataset.dataframes, LocalDataset.tables, and LocalDataset.raw_data.
Each of these attributes work the same way, but return the data in a different format.
for i in [lds.dataframes, lds.tables, lds.raw_data]:
    print(i,'n') # pprint does not work on lazy-loaded dicts
{'simpsons_characters': LazyLoadedValue(<pandas.DataFrame>), 'simpsons_episodes': LazyLoadedValue(<pandas.DataFrame>), 'simpsons_locations': LazyLoadedValue(<pandas.DataFrame>), 'simpsons_script_lines': LazyLoadedValue(<pandas.DataFrame>)}

{'simpsons_characters': LazyLoadedValue(<list of rows>), 'simpsons_episodes': LazyLoadedValue(<list of rows>), 'simpsons_locations': LazyLoadedValue(<list of rows>), 'simpsons_script_lines': LazyLoadedValue(<list of rows>)}

{'simpsons_characters': LazyLoadedValue(<bytes>), 'simpsons_episodes': LazyLoadedValue(<bytes>), 'simpsons_locations': LazyLoadedValue(<bytes>), 'simpsons_script_lines': LazyLoadedValue(<bytes>)}
LocalDataset.dataframes returns a dictionary of pandas DataFrame objects, where as LocalDataset.tables and LocalDataset.raw_data returns the data in dictionaries of Python lists and bytes format respectively. Lists can be useful if we don't want to use pandas, and bytes is great if we have binary data like images or database files.
Because of the power of the pandas library, let's use LocalDataset.dataframes to explore and have some fun with our data!
simpsons_eps = lds.dataframes['simpsons_episodes']
print(simpsons_eps.info())
simpsons_eps.head()
<class 'pandas.core.frame.dataframe'="">
RangeIndex: 600 entries, 0 to 599
Data columns (total 13 columns):
id                        600 non-null int64
title                     600 non-null object
original_air_date         600 non-null object
production_code           600 non-null object
season                    600 non-null int64
number_in_season          600 non-null int64
number_in_series          600 non-null int64
us_viewers_in_millions    594 non-null float64
views                     596 non-null float64
imdb_rating               597 non-null float64
imdb_votes                597 non-null float64
image_url                 600 non-null object
video_url                 600 non-null object
dtypes: float64(4), int64(4), object(5)
memory usage: 61.0+ KB
None
We can use the original_air_date column to look at how episodes have trended over time. First, let's extract the year from that column and then use pivot tables to visualize how IMDB ratings have trended over time:
simpsons_eps['original_air_date'] = pd.to_datetime(simpsons_eps['original_air_date'])
simpsons_eps['original_air_year'] = simpsons_eps['original_air_date'].dt.year

simpsons_eps.pivot_table(index='original_air_year',values='imdb_rating').plot()
plt.show()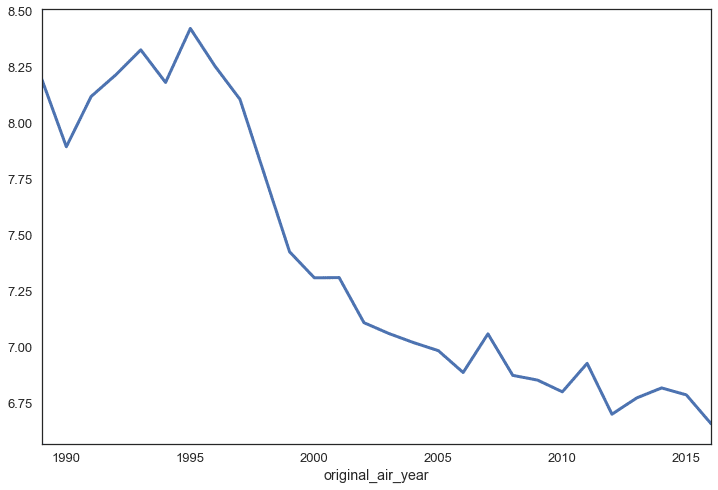
We can see here that according to IMDB raters, the quality of The Simpsons episodes were high in the first 6 years,and have been in a steady decline since then.
Access the data using SQL/SparQL queries
The second way of accessing your data using the data.world python library is using the .query() function, which allows you to access data.world's query tool.
The query() function returns a QueryResults object which has three attributes, similar to the attributes of the LocalDataset object: QueryResults.dataframe, QueryResults.table, and QueryResults.raw_data.
The query tool uses dwSQL, data.world's own flavor of SQL which accepts most standard SQL functions and query types. If you pass the optional querytype='sparql' parameter to the function, it will also accept SPARQL queries.
The query tool allows you to join data from multiple data sets together, as well as retrieve subsets of larger data so that you can transfer the burden of processing larger data away from your local system.
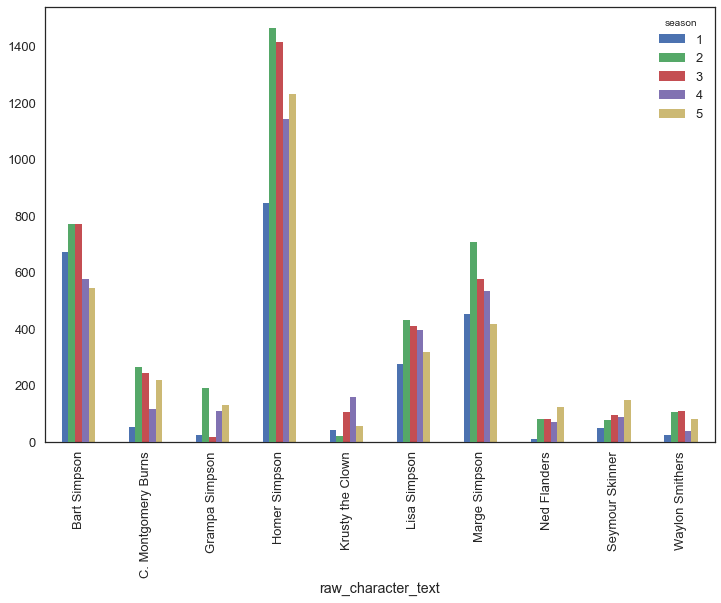
Let's look at an example of this. Using Our query can also be used to join data across multiple tables in a single data set, or even across multiple data sets. Let's modify our characters query to compare character lines for our top characters across the first 5 seasons: In addition to To demonstrate this, let's add the chalkboard gags from the start of each Simpsons episode to the We're going to start by pulling down a list of chalkboard gags from the web, cleaning them to be ready to joined to the main table. Notice that we have named the column with the episode IDs the same as it exists in the original table, which will let us easily join the data together. Let's join our chalkboard quotes to the original table, and export it as a CSV. We're almost ready to upload our modification. The following code: Currently, the API wrapper in the data.world python library is limited to 8 methods, listed in the README.md for the library. You can read more on how each works via the docstrings in the code for the library, as well as look at the main API documentation. The three ways you can work with the data.world Python library — I'd love to hear how you're using the data.world Python library — let me know! Thanks to data.world for giving me advanced access to their Python Library to write this post. If you have any suggestions on how the data.world library can be improved, you can submit issues and pull requests via the project GitHub repositorysimpsons_script_lines contains 158,000 lines from Simpsons episodes. Let's use the iPython magic command
LocalDataset object before processing the data in pandas.QueryResults.query() to get data.world's query tool to process the data and then return us the results.
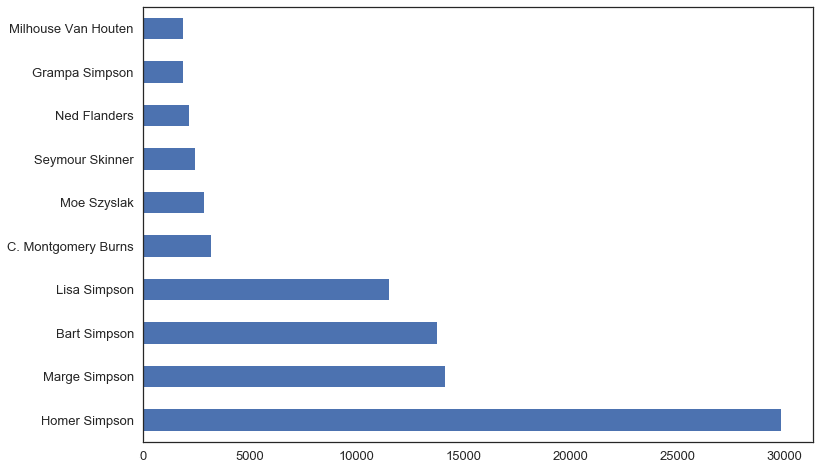
def pandas_lines_by_characters():
simpsons_script = lds.dataframes['simpsons_script_lines']
simpsons_script = simpsons_script[simpsons_script['raw_character_text'] != '']
top_10 = simpsons_script['raw_character_text'].value_counts().head(10)
top_10.plot.barh()
plt.show()
1 loop, best of 1: 33.6 s per loop
def query_lines_by_characters():
lds = dw.load_dataset('data-society/the-simpsons-by-the-data',force_update=True)
q ='''
select
raw_character_text,
count(*) as num_lines
from simpsons_script_lines
where raw_character_text != ''
group by raw_character_text
order by num_lines desc;
'''
qr = dw.query('data-society/the-simpsons-by-the-data',q)
top_10 = qr.dataframe.set_index('raw_character_text').head(10)
top_10['num_lines'].plot.barh()
plt.show()
1 loop, best of 1: 2.38 s per loop
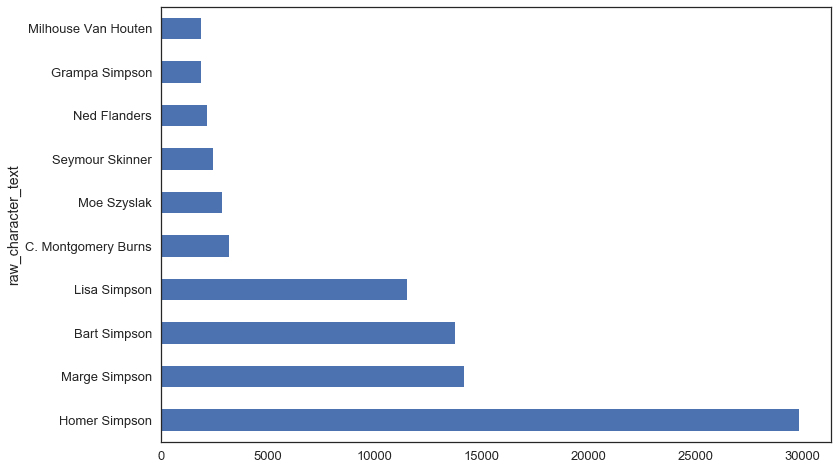
.query() reduced our run time from 36 to 2 seconds - that's a 94
q =
'''
select
ssl.raw_character_text,
se.season, count(*)
as num_lines
from simpsons_script_lines ssl
inner join simpsons_episodes se
on se.id = ssl.episode_id
where ssl.raw_character_text != ''
and se.season < 6
group by
ssl.raw_character_text,
se.season
order by num_lines desc;
'''
qr = dw.query('data-society/the-simpsons-by-the-data',q)
df = qr.dataframe
char_counts = df.pivot_table(index='raw_character_text',
values='num_lines',aggfunc=sum)
top_10_chars = char_counts.sort_values(ascending=False).iloc[:10].index
top_10 = df[df['raw_character_text'].isin(top_10_chars)]
pivot = top_10.pivot_table(index='raw_character_text',
columns='season',values='num_lines')
pivot.plot.bar()
plt.show()
Using the data.world API
load_dataset() and query(), the data.world library offers a wrapper around the full data.world API, which gives you access to a number of powerful functions that allow you to read, create and modify data sets on data.world.simpsons_episodes file. Note that you would need to be a contributor or owner to the dataset to be able to make changes using the API.
# create a list of dataframes from the tables listed on simpsons.wikia.co,
chalkboard_dfs = pd.read_html('https://simpsons.wikia.com/wiki/List_of_chalkboard_gags',match='Gag')
# remove the simpsons movie from the list
chalkboard_dfs = [i for i in chalkboard_dfs if i.shape[0] != 2]
# inspect the format of our dataframes
chalkboard_dfs[0].head()
0
1
2
3
4
0
#
Airdate
Screenshot
Gag
Episode title
1
1
December 17, 1989
NaN
no gag
Simpsons Roasting on an Open Fire
2
2
January 14, 1990
NaN
I will not waste chalk
Bart the Genius
3
3
January 21, 1990
NaN
I will not skateboard in the halls
Homer's Odyssey
4
4
January 28, 1990
NaN
I will not burp in class
There's No Disgrace Like Home
# the first row contains the column names, let's create a function to fix this
def cb_cleanup(df):
df.columns = df.iloc[0]
df = df.iloc[1:]
return df
# and then apply the function to the whole list
chalkboard_dfs = [cb_cleanup(i) for i in chalkboard_dfs]
# join the list of dataframes into one big dataframe
chalkboards = pd.concat(chalkboard_dfs,ignore_index=True)
# remove bad row without an id
chalkboards = chalkboards[pd.notnull(chalkboards['#'])]
print(chalkboards.shape)
chalkboards.head()
(605,5)
#
Airdate
Screenshot
Gag
Episode title
0
1
December 17, 1989
NaN
no gag
Simpsons Roasting on an Open Fire
1
2
January 14, 1990
NaN
I will not waste chalk
Bart the Genius
2
3
January 21, 1990
NaN
I will not skateboard in the halls
Homer's Odyssey
3
4
January 28, 1990
NaN
I will not burp in class
There's No Disgrace Like Home
4
5
February 4, 1990
NaN
no gag - shortened opening due to time
Bart the General
# remove extra columns and normalize column names
chalkboards = chalkboards[['#','Gag']]
chalkboards.columns = ['id','chalkboard_gag']
# convert id column to int
chalkboards['id'] = chalkboards['id'].astype(int)
chalkboards.head()
id
chalkboard_gag
0
1
no gag
1
2
I will not waste chalk
2
3
I will not skateboard in the halls
3
4
I will not burp in class
4
5
no gag - shortened opening due to time
lds = dw.load_dataset('data-society/the-simpsons-by-the-data')
simpsons_episodes = lds.dataframes['simpsons_episodes']
simpsons_episodes = simpsons_episodes.merge(chalkboards,how='left',on='id')
simpsons_episodes.head()
id
title
original_air_date
production_code
season
number_in_season
number_in_series
us_viewers_in_millions
views
imdb_rating
imdb_votes
image_url
video_url
chalkboard_gag
0
10
Homer's Night Out
1990-03-25
7G10
1
10
10
30.3
50816.0
7.4
1511.0
https://static-media.fxx.com/img/FX_Networks_-_...
I will not call my teacher "Hot Cakes"
1
12
Krusty Gets Busted
1990-04-29
7G12
1
12
12
30.4
62561.0
8.3
1716.0
https://static-media.fxx.com/img/FX_Networks_-_...
They are laughing at me, not with me
2
14
Bart Gets an "F"
1990-10-11
7F03
2
1
14
33.6
59575.0
8.2
1638.0
https://static-media.fxx.com/img/FX_Networks_-_...
I will not encourage others to fly. (And in th...
3
17
Two Cars in Every Garage and Three Eyes on Eve...
1990-11-01
7F01
2
4
17
26.1
64959.0
8.1
1457.0
https://static-media.fxx.com/img/FX_Networks_-_...
I will not Xerox my butt. It's potato, Not pot...
4
19
Dead Putting Society
1990-11-15
7F08
2
6
19
25.4
50691.0
8.0
1366.0
https://static-media.fxx.com/img/FX_Networks_-_...
I am not a 32 year old woman (Which at the tim...
simpsons_episodes.to_csv('simpsons_episodes.csv',index=False)
client = dw.api_client()
client.upload_files('data-society/the-simpsons-by-the-data',files='simpsons_episodes.csv')
load_dataset(), query() and api_client() — give you a powerful toolset to streamline working with data.