What Is Power BI and Why Should You Learn It?
If you’re interested in a career in data analytics — or really, any job where you’ll work with data regularly — you owe it to yourself to at least consider learning Power BI.
We’ll get into the why in a moment, but first, let's answer the question What is Power BI?
What Is Power BI?
Power BI is a collection of software services, apps, and connectors that work together to turn your unrelated sources of data into coherent, visually immersive, and interactive insights. You can connect it to any kind of data source and build powerful data visualizations.
It is the industry-leading business intelligence platform and data solution of choice for companies around the world. In 2022, the business intelligence market represented $27.24 billion, and that number is projected to hit $54.92 billion by 2032. The demand for Power BI is huge, and it’s still growing.
So what’s the secret to Power BI’s success? It’s secure, it integrates a lot of tech in one convenient place, and it’s easy to implement. These factors make it a no-brainer for loads of companies.
Imagine, for example, you have mounds of data on consumer spending habits. You need to break that data down to find the useful patterns, and then collate that data into a report that a product department can understand and study to schedule releases. That is exactly the sort of task you’d use Power BI for, and that's why you need to learn Power BI if you aspire to become a data analyst.
Still not convinced? Let’s go deeper, and take a look at six reasons why learning Power BI is worth your time.
Why Should You Learn Power BI?
1. It’s Powerful
At its core, Power BI has three main technologies:
Power Pivot
Power Pivot is “a data modeling technology that lets you create data models, establish relationships, and create calculations” (Microsoft). You can use Power Pivot to work with large datasets, build relationships, and create calculations, all in the same place.
Power Query
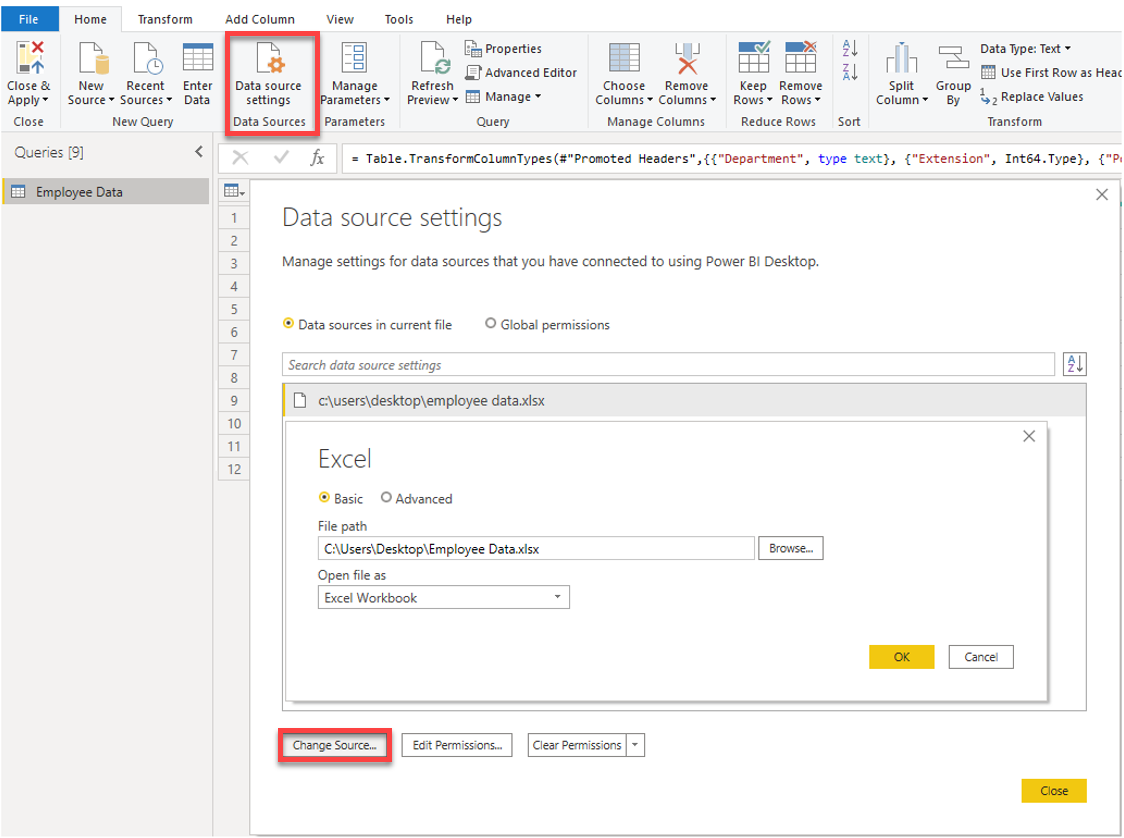
Power Query is Microsoft’s data connectivity and data preparation technology. It allows you to access data from hundreds of different sources, from CSVs to SQL databases, and adjust that data to fit your needs. You don’t need any code to use Power Query, and it offers an intuitive, user-friendly interface.
Power View
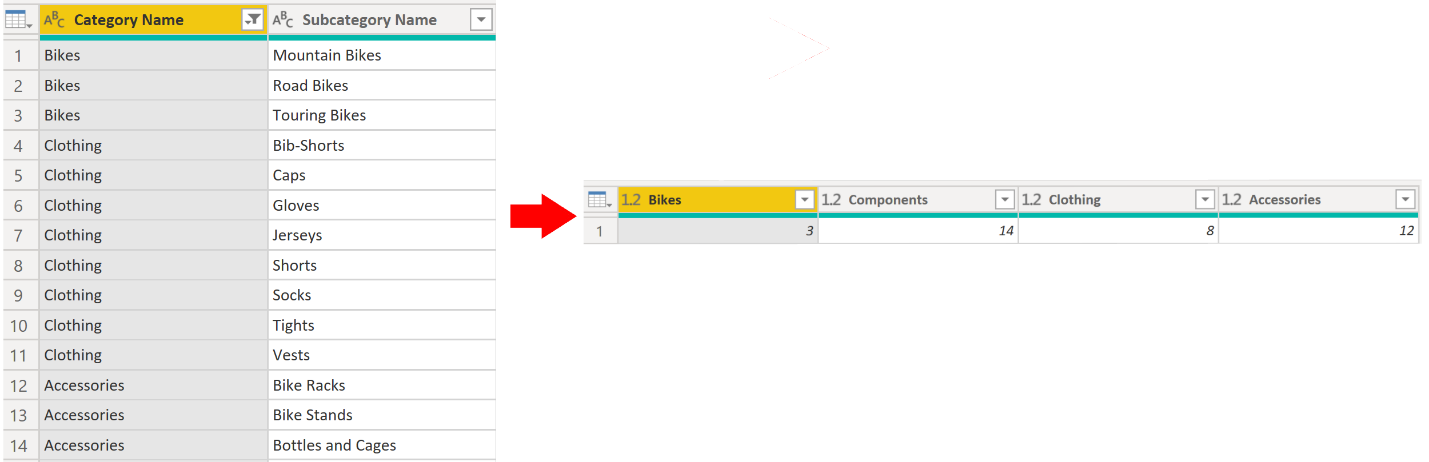
Power View allows you to visually shape and explore your data. It’s a very powerful visualization technology that lets you create charts, graphs, maps, and many other types of data visualizations to build easy-to-understand, interactive reports and dashboards. You can use it in Excel, SharePoint, SQL Server, and Power BI.
The power of all three of these technologies in combination makes Power BI a one-stop-shop for many data analysis tasks, because it can ingest data from almost any source or sources your company uses; it allows you to perform any necessary data cleaning, organization, transformation, and additional calculations; and then it formats everything into charts and other visualizations with drag-and-drop simplicity. And it can do all of that even when you’re working with very large datasets — hundreds of thousands of rows, or even more.
2. It’s an In-Demand Skill
There are tons of jobs hiring right now for candidates with Power BI skills. You can easily confirm this for yourself: just search for “Power BI” on a jobs site such as LinkedIn Jobs.
That’s because thanks to both its power and its seamless integration with Microsoft’s suite of other professional tools and applications — which thousands and thousands of companies use — Power BI is a logical tool for any organization that’s looking to better understand this data. And these days, that describes just about every company on Earth.
Adding Power BI skills and projects to your resume will show employers that you’ve got the data analysis skills they need and that you’re already up and running with an analytics tool that they know integrates well with the other tools and the databases they’re likely already using.
3. It Can Help You Kickstart a New Career
As we’ve mentioned, Power BI is an important skill for aspiring data analysts. Thanks to its relatively gentle learning curve, it’s a great way for aspiring analysts to get a foot in the door of the industry. But because it’s so powerful and can handle a lot of complexity, it’s not simply a “beginner” tool. Employers know that analysts with Power BI skills can handle even advanced analytics tasks.
It’s also worth mentioning that many employers need analysts with Power BI skills because they’re already heavily invested in the Microsoft ecosystem, and no other approach to data analytics works as seamlessly as Power BI in that context. Even when you have advanced programming skills, too, you may find potential employers are more interested in your Power BI skills, because they know that will enable you to easily produce reports, dashboards, and apps that anyone at the company can easily consume.
And Power BI is a valuable skill in lots of other career paths, too. Browse job listings that mention Power BI, and you’ll see job titles like “Power BI Data Analyst,” but also titles like these . . .
- Marketing Specialist
- Data Coordinator
- Project Manager
- CX Analyst
- Systems Administrator
- BI Developer
- Bioinformatics Analyst
- Performance Analyst
- Project Engineer
. . . and many, many more. That’s because these days, working with and understanding data plays a major role in many jobs. Even if you don’t aspire to work as a full-time data analyst, showing employers that you have the skills to analyze and visualize the data that’s associated with the work you’re doing can give you a major leg up on the competition.
4. It Makes Visualizing Data Easier
In a business context, your data analysis is only worthwhile if it is understandable enough to affect decisions. And since humans aren’t great at pulling patterns from spreadsheets with thousands or millions of rows, that generally means visualizing that data.
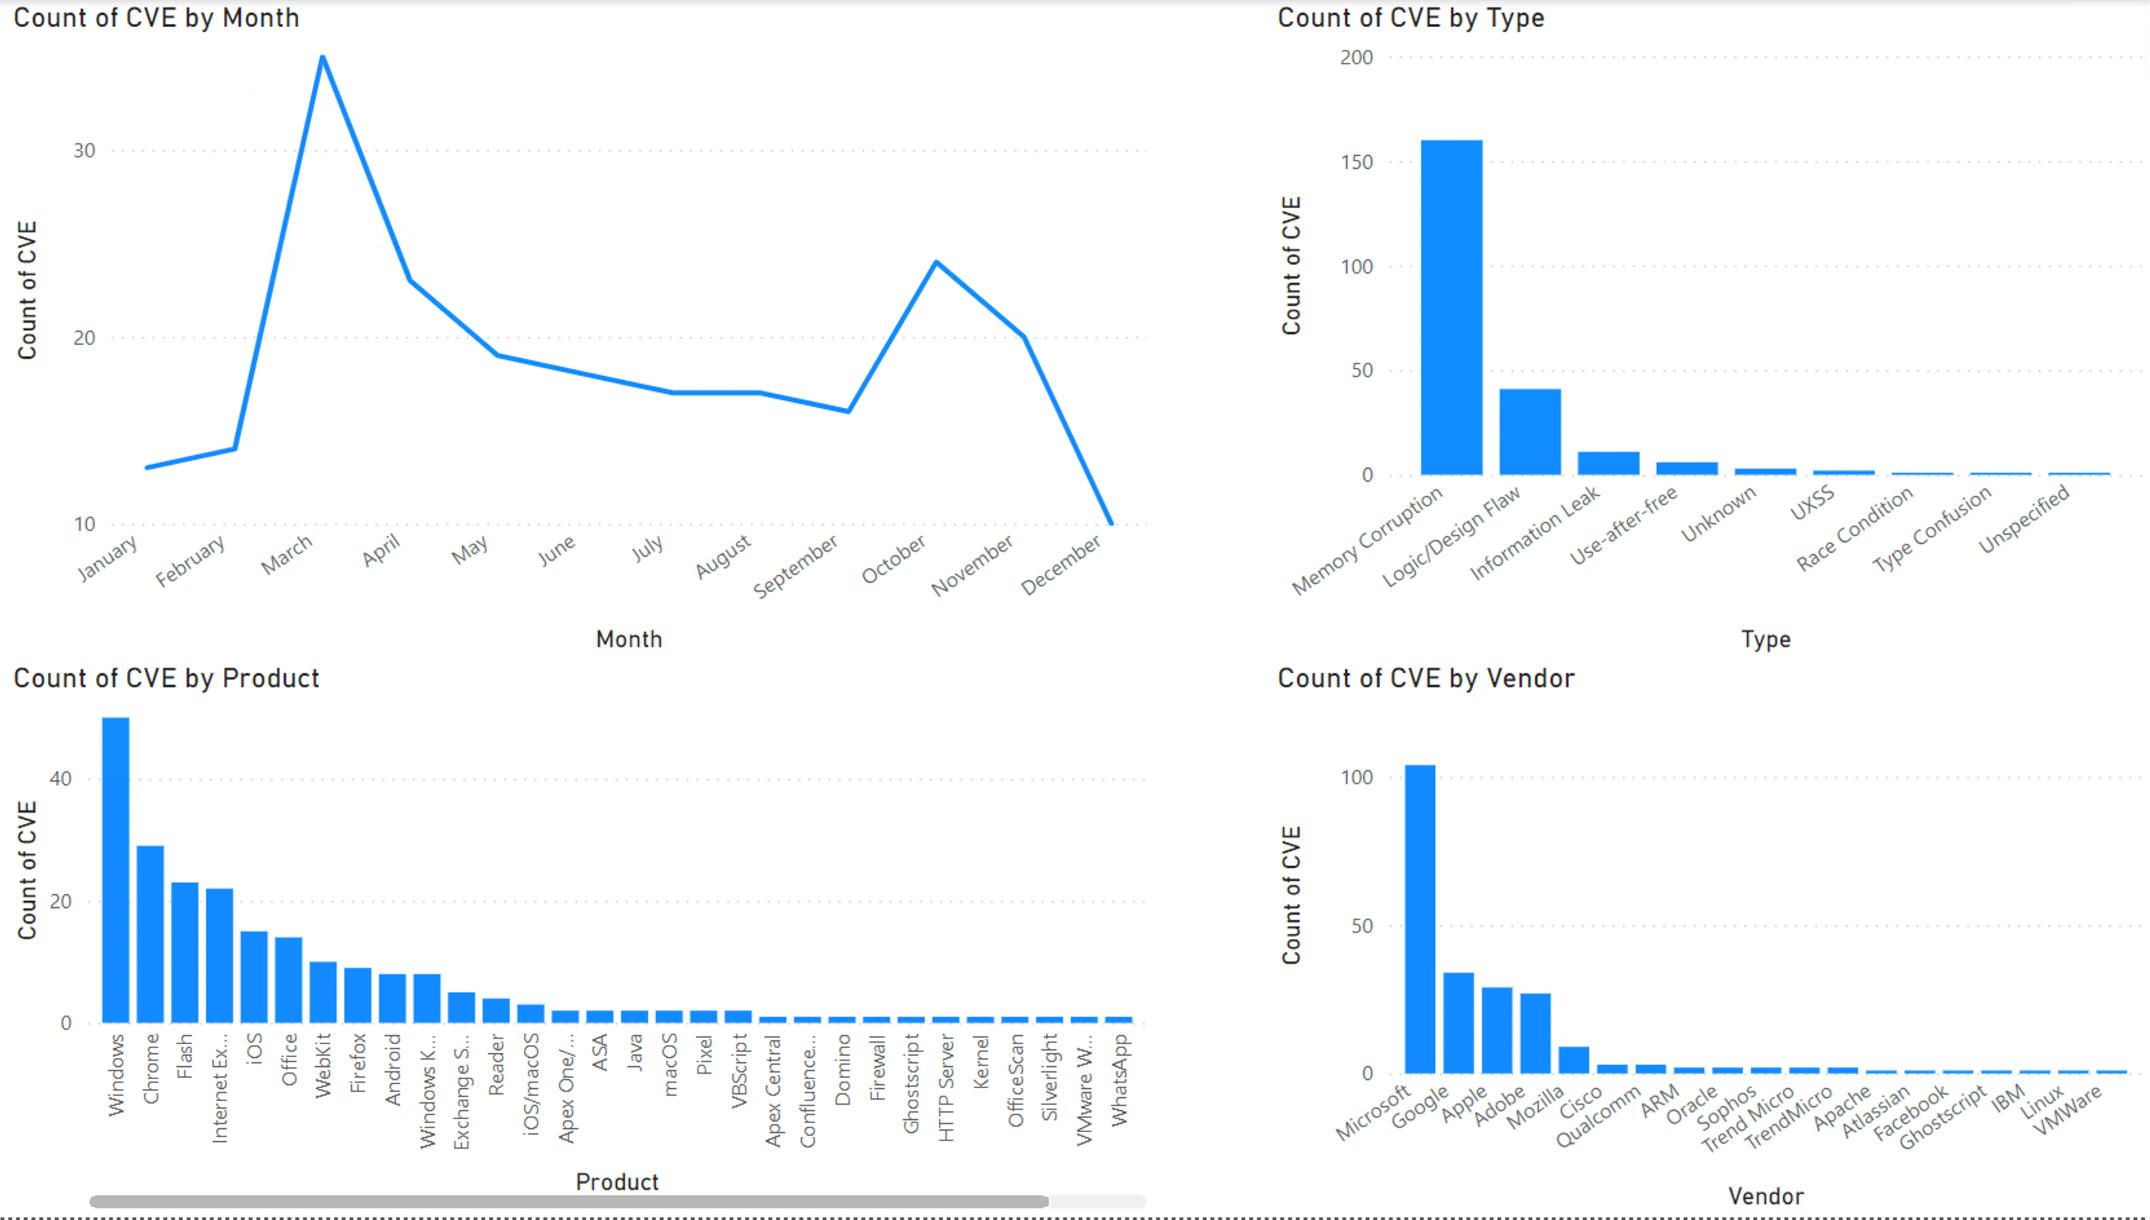
And while there are lots of ways of visualizing data, few of them are as straightforward as Power BI’s drag-and-drop chart-building interface. Once your data is cleaned and ready for analysis, you can use Power BI to create beautiful, interactive visualizations that unlock meaningful insights in literally just seconds.
Other data analysis tools like Excel, Python, and R can create charts too, of course — but none of them are as quick and simple as Power BI can be once you’ve mastered the basics.
5. It Can Handle Big Data
If you’ve ever tried to open up a spreadsheet with hundreds of thousands of rows in Excel and then perform some kind of calculations with it, you probably know that while it’s a great tool for working with data, it wasn’t really designed for working with big data.
Power BI was. It allows for uploads of datasets as large as 10 GB, and it can actually work with datasets even larger than that with the correct settings enabled.
If you want to work with big data but prefer to have a GUI rather than writing code, Power BI is arguably the best tool for the job.
6. It’s Fun!
Admittedly, this is subjective, but there’s something really satisfying about working with Power BI. Data cleaning is fast and fairly intuitive, and once you’ve got everything ready for visualization, it’s fun to drag and drop data into different chart types and see what kinds of patterns you can uncover.
And because it’s a tool for creating presentations and dashboards, too, it’s satisfying and fun to make your charts look pretty. Plus, the built-in tools for sharing reports and dashboards (including mobile-friendly ones) means that you can show off the fruits of your labor to anyone who’s interested.
Who Can Learn Power BI?
The answer to this question is simple – anyone can learn it and there are no prerequisites. Power BI is very powerful, but don’t let that scare you: it has a learning curve that’s actually pretty friendly. Like any new application, it still takes a bit of time to wrap your head around — that’s what our Power BI courses are for! But if you already have some experience with Excel, Power BI won’t feel too different once you learn the basics.
In fact, in some ways, Power BI is actually easier to use than Excel. For example, once you get the hang of it, creating complex visualizations in Power BI is a snap, and you’ll be able to do it much faster than you could in Excel.
We as tech educators are strong believers that anyone can learn to code, and learning programming languages like Python and R unlocks a pretty limitless world of data analysis possibilities. But there’s no denying that with its visual UI and drag-and-drop interface, Power BI is likely to take less time to learn than a new coding language for aspiring data analysts who don’t already have some programming experience.
(And if you do have programming experience, Power BI can actually integrate custom Python and R code you write, allowing you to do even more!)
How to Learn Power BI and Get Certified
You can find a lot of resources online to learn Power BI. In fact, Microsoft has complete Power BI documentation on their website. But if you would like to dig deeper and do hands-on Power BI projects, we encourage you to sign up for free to access our Power BI resources.
Another problem is showing your value to potential employers. Consider a portfolio or Power BI Certificates. When you are ready, you might want to jump to take the Power BI exam by Microsoft which costs $165 in the United States.
Conclusion
Power BI, owned by Microsoft, is a collection of software services, apps, and connectors that help you turn your raw data into visually engaging reports and dashboards. Businesses use Power BI to analyze their company data and make informed decisions.
At the end of the day, there are a lot of great reasons to learn Power BI. Check out Dataquest’s Analyzing Data with Power BI skill path and start learning today!
