A Simple Guide to Linear Regression for Machine Learning
In this tutorial, we'll learn about linear regression and how to implement it in Python. First, we'll explore a sample machine learning problem, and then we'll develop a model to make predictions. (This tutorial assumes some familiarity with Python syntax and data cleaning.)
The Problem
The dataset that we'll be examining is the Automobile Data Set from the UCI Machine Learning Repository. This dataset contains information on various car characteristics, including vehicle type and engine type, among many others.
Imagine that we're taking on the role of a data analyst at an auto insurance company. We've been tasked with ranking cars in terms of their "riskiness," a measure of how likely a car is to get into an accident and therefore require the driver to use their insurance. Riskiness isn't something we know about a car just by looking at it, so we need to use other qualities that we can see and measure.
To solve our problem, we'll turn to a machine learning model that can convert our data into useful predictions. There are several machine learning models that we can use, but we'll turn our attention to linear regression.
The Linear Regression Model
Before we begin the analysis, we'll examine the linear regression model to understand how it can help solve our problem. A linear regression model with a single feature looks like the following:
$$
Y = \beta_0 + \beta_1 X_1 + \epsilon
$$
$Y$ represents the outcome that we want to predict. In our example, it's car riskiness. $X_1$ here is a "feature" or "predictor", which represents a car attribute that we want to use to predict the outcome. $X$ and $Y$ are things we observe and collect data on. Below, we show a visualization of the linear regression above:
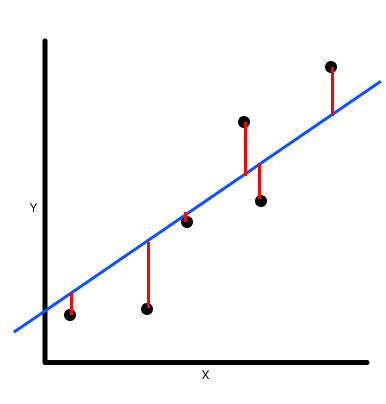
$\beta_1$ represents the "slope", or how the outcome $Y$ changes when the feature $X$ changes. $\beta_0$ represents the "intercept", which would be the average value of the outcome when the feature is 0. $\epsilon$ represents the "error" left over that isn't explained by the feature $X$, visualized by the red lines. These values, $\beta_0$, $\beta_1$, and $\epsilon$, are called parameters, and we need to calculate them from the data.
We could also add more predictors into the model by adding another parameter $\beta_2$ to be associated with the other features. For example, adding a second feature would result in a model that looks like this:
$$
Y = \beta_0 + \beta_1 X_1 + \beta_2 X_2 + \epsilon
$$
We can calculate these parameters by hand, but it would be more efficient to use Python to create our linear regression model.
Checking The Data
The first step in creating a machine learning model is to examine the data! We'll load in the pandas library, so that we can read in the Automobiles Data Set, which is stored as a .csv file.
import pandas as pd

automobiles = pd.read_csv("automobiles.csv")
print(automobiles.columns)
[1] Index(['symboling', 'normalized_losses', 'make', 'fuel_type', 'aspiration', 'num_of_doors', 'body_style', 'drive_wheels', 'engine_location', 'wheel_base', 'length', 'width', 'height', 'curb_weight', 'engine_type', 'num_of_cylinders', 'engine_size', 'fuel_system', 'bore', 'stroke', 'compression_ratio', 'horsepower', 'peak_rpm', 'city_mpg', 'highway_mpg', 'price'], dtype='object')For this tutorial, we'll use the engine_size and horsepower columns for our features in the linear regression model. Our intuition here is that as engine size increases, the car becomes more powerful and capable of higher speeds. These higher speeds might lead to more accidents, which lead to higher "riskiness".
The column that captures this "riskiness" is the symboling column. The symboling column ranges from -3 to 3, where the higher the value, the riskier the car.
Realistically, the process of picking features for a linear regression model is done more through trial-and-error. We've picked engine size using an intuition, but it would be better to try to improve our predictions based on this initial model.
The Solution
We can quickly create linear regressions using the scikit-learn Python library. Linear regressions are contained in the LinearRegression class, so we'll import everything we need below:
from sklearn.linear_model import LinearRegression

model = LinearRegression()
We've imported the LinearRegression class and stored an instance of it in the model variable. The next step is to divide the data into a training set and a test set. We'll use the training set to estimate the parameters of the linear regression, and we'll use the test set to check how well the model predicts the riskiness of cars it hasn't seen before.
import math

# Calculate how many rows 80
nrows = math.floor(automobiles.shape[0] * 0.8)

# Divide the data using this calculation
training = automobiles.loc[:nrows]
test = automobiles.loc[nrows:]
In the code above, we've dedicated 80
X = training[["engine_size", "horsepower"]]
Y = training["symboling"]
model.fit(X, Y)
The fit() method takes in the features and the outcome and uses them to estimate the model parameters. After these parameters are estimated, we have a usable model!
Model Performance
We can try to predict the values of the symboling column in the test set and see how it performs.
import numpy as np

predictions = model.predict(test[["engine_size", "horsepower"]])

mae = np.mean((test["symboling"] - predictions)**2)
After running the fit() method on the training data, we can call the predict() method on new data containing the same columns. Using these predictions, we can calculate the mean absolute error (MAE). The MAE describes how far the model predictions are from the actual symboling values on average.
print(mae)[1] 1.7894647963388066The model has an average test error of about 1.79. This is a solid start, but we might be able to improve the error by including more features or using a different model.
Next Steps
In this tutorial, we learned about the linear regression model, and we used it to predict car riskiness based on engine size and horsepower. The linear regression is one of the most commonly used data science tools because it matches well with human intuition. We can see how changes in the predictors produces proportion changes in the outcome. We examined the data, constructed a model in Python, and used this model to produce predictions. This process is at the core of the machine learning workflow and is essential knowledge for any data scientist.
If you'd like to learn more about linear regression and add it to your machine learning skill set, Dataquest has a full course covering the topic in our Data Scientist in Python Career Path.