How to Read an Excel File in Python (w/ 21 Code Examples)
Microsoft Excel is one of the most powerful spreadsheet software applications in the world, and it has become critical in all business processes. Companies across the world, both big and small, are using Microsoft Excel to store, organize, analyze, and visualize data.
As a data professional, when you combine Python with Excel, you create a unique data analysis bundle that unlocks the value of the enterprise data.
In this tutorial, we're going to learn how to read and work with Excel files in Python.
After you finish this tutorial, you'll understand the following:
- Loading Excel spreadsheets into pandas DataFrames
- Working with an Excel workbook with multiple spreadsheets
- Combining multiple spreadsheets
- Reading Excel files using the
xlrdpackage
In this tutorial, we assume you know the fundamentals of pandas DataFrames. If you aren't familiar with the pandas library, you might like to try our Pandas and NumPy Fundamentals – Dataquest.
Let's dive in.
Reading Spreadsheets with Pandas
Technically, multiple packages allow us to work with Excel files in Python. However, in this tutorial, we'll use pandas and xlrd libraries to interact with Excel workbooks. Essentially, you can think of a pandas DataFrame as a spreadsheet with rows and columns stored in Series objects. Traversability of Series as iterable objects allows us to grab specific data easily. Once we load an Excel workbook into a pandas DataFrame, we can perform any kind of data analysis on the data.
Before we proceed to the next step, let's first download the following spreadsheet:
Sales Data Excel Workbook - xlsx ver.
The Excel workbook consists of two sheets that contain stationery sales data for 2020 and 2021.
NOTE
Although Excel spreadsheets can contain formula and also support formatting, pandas only imports Excel spreadsheets as flat files, and it doesn't support spreadsheet formatting.
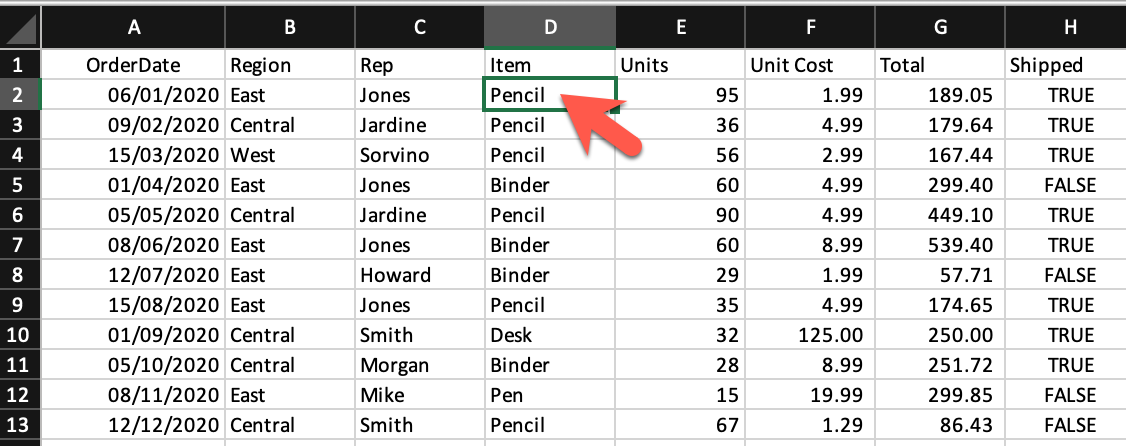
To import the Excel spreadsheet into a pandas DataFrame, first, we need to import the pandas package and then use the read_excel() method:
import pandas as pd
df = pd.read_excel('sales_data.xlsx')

display(df)| OrderDate | Region | Rep | Item | Units | Unit Cost | Total | Shipped | |
|---|---|---|---|---|---|---|---|---|
| 0 | 2020-01-06 | East | Jones | Pencil | 95 | 1.99 | 189.05 | True |
| 1 | 2020-02-09 | Central | Jardine | Pencil | 36 | 4.99 | 179.64 | True |
| 2 | 2020-03-15 | West | Sorvino | Pencil | 56 | 2.99 | 167.44 | True |
| 3 | 2020-04-01 | East | Jones | Binder | 60 | 4.99 | 299.40 | False |
| 4 | 2020-05-05 | Central | Jardine | Pencil | 90 | 4.99 | 449.10 | True |
| 5 | 2020-06-08 | East | Jones | Binder | 60 | 8.99 | 539.40 | True |
| 6 | 2020-07-12 | East | Howard | Binder | 29 | 1.99 | 57.71 | False |
| 7 | 2020-08-15 | East | Jones | Pencil | 35 | 4.99 | 174.65 | True |
| 8 | 2020-09-01 | Central | Smith | Desk | 32 | 125.00 | 250.00 | True |
| 9 | 2020-10-05 | Central | Morgan | Binder | 28 | 8.99 | 251.72 | True |
| 10 | 2020-11-08 | East | Mike | Pen | 15 | 19.99 | 299.85 | False |
| 11 | 2020-12-12 | Central | Smith | Pencil | 67 | 1.29 | 86.43 | False |
If you want to load only a limited number of rows into the DataFrame, you can specify the number of rows using the nrows argument:
df = pd.read_excel('sales_data.xlsx', nrows=5)
display(df)| OrderDate | Region | Rep | Item | Units | Unit Cost | Total | Shipped | |
|---|---|---|---|---|---|---|---|---|
| 0 | 2020-01-06 | East | Jones | Pencil | 95 | 1.99 | 189.05 | True |
| 1 | 2020-02-09 | Central | Jardine | Pencil | 36 | 4.99 | 179.64 | True |
| 2 | 2020-03-15 | West | Sorvino | Pencil | 56 | 2.99 | 167.44 | True |
| 3 | 2020-04-01 | East | Jones | Binder | 60 | 4.99 | 299.40 | False |
| 4 | 2020-05-05 | Central | Jardine | Pencil | 90 | 4.99 | 449.10 | True |
Skipping a specific number of rows from the begining of a spreadsheet or skipping over a list of particular rows is available through the skiprows argument, as follows:
df = pd.read_excel('sales_data.xlsx', skiprows=range(5))
display(df)| 2020-05-05 00:00:00 | Central | Jardine | Pencil | 90 | 4.99 | 449.1 | True | |
|---|---|---|---|---|---|---|---|---|
| 0 | 2020-06-08 | East | Jones | Binder | 60 | 8.99 | 539.40 | True |
| 1 | 2020-07-12 | East | Howard | Binder | 29 | 1.99 | 57.71 | False |
| 2 | 2020-08-15 | East | Jones | Pencil | 35 | 4.99 | 174.65 | True |
| 3 | 2020-09-01 | Central | Smith | Desk | 32 | 125.00 | 250.00 | True |
| 4 | 2020-10-05 | Central | Morgan | Binder | 28 | 8.99 | 251.72 | True |
| 5 | 2020-11-08 | East | Mike | Pen | 15 | 19.99 | 299.85 | False |
| 6 | 2020-12-12 | Central | Smith | Pencil | 67 | 1.29 | 86.43 | False |
The code above skips the first five rows and returns the rest of the data. Instead, the following code returns all the rows except for those with the mentioned indices:
df = pd.read_excel('sales_data.xlsx', skiprows=[1, 4,7,10])
display(df)| OrderDate | Region | Rep | Item | Units | Unit Cost | Total | Shipped | |
|---|---|---|---|---|---|---|---|---|
| 0 | 2020-02-09 | Central | Jardine | Pencil | 36 | 4.99 | 179.64 | True |
| 1 | 2020-03-15 | West | Sorvino | Pencil | 56 | 2.99 | 167.44 | True |
| 2 | 2020-05-05 | Central | Jardine | Pencil | 90 | 4.99 | 449.10 | True |
| 3 | 2020-06-08 | East | Jones | Binder | 60 | 8.99 | 539.40 | True |
| 4 | 2020-08-15 | East | Jones | Pencil | 35 | 4.99 | 174.65 | True |
| 5 | 2020-09-01 | Central | Smith | Desk | 32 | 125.00 | 250.00 | True |
| 6 | 2020-11-08 | East | Mike | Pen | 15 | 19.99 | 299.85 | False |
| 7 | 2020-12-12 | Central | Smith | Pencil | 67 | 1.29 | 86.43 | False |
Another useful argument is usecols, which allows us to select spreadsheet columns with their letters, names, or positional numbers. Let's see how it works:
df = pd.read_excel('sales_data.xlsx', usecols='A:C,G')
display(df)| OrderDate | Region | Rep | Total | |
|---|---|---|---|---|
| 0 | 2020-01-06 | East | Jones | 189.05 |
| 1 | 2020-02-09 | Central | Jardine | 179.64 |
| 2 | 2020-03-15 | West | Sorvino | 167.44 |
| 3 | 2020-04-01 | East | Jones | 299.40 |
| 4 | 2020-05-05 | Central | Jardine | 449.10 |
| 5 | 2020-06-08 | East | Jones | 539.40 |
| 6 | 2020-07-12 | East | Howard | 57.71 |
| 7 | 2020-08-15 | East | Jones | 174.65 |
| 8 | 2020-09-01 | Central | Smith | 250.00 |
| 9 | 2020-10-05 | Central | Morgan | 251.72 |
| 10 | 2020-11-08 | East | Mike | 299.85 |
| 11 | 2020-12-12 | Central | Smith | 86.43 |
In the code above, the string assigned to the usecols argument contains a range of columns with : plus column G separated by a comma. Also, we're able to provide a list of column names and assign it to the usecols argument, as follows:
df = pd.read_excel('sales_data.xlsx', usecols=['OrderDate', 'Region', 'Rep', 'Total'])
display(df)| OrderDate | Region | Rep | Total | |
|---|---|---|---|---|
| 0 | 2020-01-06 | East | Jones | 189.05 |
| 1 | 2020-02-09 | Central | Jardine | 179.64 |
| 2 | 2020-03-15 | West | Sorvino | 167.44 |
| 3 | 2020-04-01 | East | Jones | 299.40 |
| 4 | 2020-05-05 | Central | Jardine | 449.10 |
| 5 | 2020-06-08 | East | Jones | 539.40 |
| 6 | 2020-07-12 | East | Howard | 57.71 |
| 7 | 2020-08-15 | East | Jones | 174.65 |
| 8 | 2020-09-01 | Central | Smith | 250.00 |
| 9 | 2020-10-05 | Central | Morgan | 251.72 |
| 10 | 2020-11-08 | East | Mike | 299.85 |
| 11 | 2020-12-12 | Central | Smith | 86.43 |
The usecols argument accepts a list of column numbers, too. The following code shows how we can pick up specific columns using their indices:
df = pd.read_excel('sales_data.xlsx', usecols=[0, 1, 2, 6])
display(df)| OrderDate | Region | Rep | Total | |
|---|---|---|---|---|
| 0 | 2020-01-06 | East | Jones | 189.05 |
| 1 | 2020-02-09 | Central | Jardine | 179.64 |
| 2 | 2020-03-15 | West | Sorvino | 167.44 |
| 3 | 2020-04-01 | East | Jones | 299.40 |
| 4 | 2020-05-05 | Central | Jardine | 449.10 |
| 5 | 2020-06-08 | East | Jones | 539.40 |
| 6 | 2020-07-12 | East | Howard | 57.71 |
| 7 | 2020-08-15 | East | Jones | 174.65 |
| 8 | 2020-09-01 | Central | Smith | 250.00 |
| 9 | 2020-10-05 | Central | Morgan | 251.72 |
| 10 | 2020-11-08 | East | Mike | 299.85 |
| 11 | 2020-12-12 | Central | Smith | 86.43 |
Working with Multiple Spreadsheets
Excel files or workbooks usually contain more than one spreadsheet. The pandas library allows us to load data from a specific sheet or combine multiple spreadsheets into a single DataFrame. In this section, we'll explore how to use these valuable capabilities.
By default, the read_excel() method reads the first Excel sheet with the index 0. However, we can choose the other sheets by assigning a particular sheet name, sheet index, or even a list of sheet names or indices to the sheet_name argument. Let's try it:
df = pd.read_excel('sales_data.xlsx', sheet_name='2021')
display(df)| OrderDate | Region | Rep | Item | Units | Unit Cost | Total | Shipped | |
|---|---|---|---|---|---|---|---|---|
| 0 | 2021-01-15 | Central | Gill | Binder | 46 | 8.99 | 413.54 | True |
| 1 | 2021-02-01 | Central | Smith | Binder | 87 | 15.00 | 1305.00 | True |
| 2 | 2021-03-07 | West | Sorvino | Binder | 27 | 19.99 | 139.93 | True |
| 3 | 2021-04-10 | Central | Andrews | Pencil | 66 | 1.99 | 131.34 | False |
| 4 | 2021-05-14 | Central | Gill | Pencil | 53 | 1.29 | 68.37 | False |
| 5 | 2021-06-17 | Central | Tom | Desk | 15 | 125.00 | 625.00 | True |
| 6 | 2021-07-04 | East | Jones | Pen Set | 62 | 4.99 | 309.38 | True |
| 7 | 2021-08-07 | Central | Tom | Pen Set | 42 | 23.95 | 1005.90 | True |
| 8 | 2021-09-10 | Central | Gill | Pencil | 47 | 1.29 | 9.03 | True |
| 9 | 2021-10-14 | West | Thompson | Binder | 57 | 19.99 | 1139.43 | False |
| 10 | 2021-11-17 | Central | Jardine | Binder | 11 | 4.99 | 54.89 | False |
| 11 | 2021-12-04 | Central | Jardine | Binder | 94 | 19.99 | 1879.06 | False |
The code above reads the second spreadsheet in the workbook, whose name is 2021. As mentioned before, we also can assign a sheet position number (zero-indexed) to the sheet_name argument. Let's see how it works:
df = pd.read_excel('sales_data.xlsx', sheet_name=1)
display(df)| OrderDate | Region | Rep | Item | Units | Unit Cost | Total | Shipped | |
|---|---|---|---|---|---|---|---|---|
| 0 | 2021-01-15 | Central | Gill | Binder | 46 | 8.99 | 413.54 | True |
| 1 | 2021-02-01 | Central | Smith | Binder | 87 | 15.00 | 1305.00 | True |
| 2 | 2021-03-07 | West | Sorvino | Binder | 27 | 19.99 | 139.93 | True |
| 3 | 2021-04-10 | Central | Andrews | Pencil | 66 | 1.99 | 131.34 | False |
| 4 | 2021-05-14 | Central | Gill | Pencil | 53 | 1.29 | 68.37 | False |
| 5 | 2021-06-17 | Central | Tom | Desk | 15 | 125.00 | 625.00 | True |
| 6 | 2021-07-04 | East | Jones | Pen Set | 62 | 4.99 | 309.38 | True |
| 7 | 2021-08-07 | Central | Tom | Pen Set | 42 | 23.95 | 1005.90 | True |
| 8 | 2021-09-10 | Central | Gill | Pencil | 47 | 1.29 | 9.03 | True |
| 9 | 2021-10-14 | West | Thompson | Binder | 57 | 19.99 | 1139.43 | False |
| 10 | 2021-11-17 | Central | Jardine | Binder | 11 | 4.99 | 54.89 | False |
| 11 | 2021-12-04 | Central | Jardine | Binder | 94 | 19.99 | 1879.06 | False |
As you can see, both statements take in either the actual sheet name or sheet index to return the same result.
Sometimes, we want to import all the spreadsheets stored in an Excel file into pandas DataFrames simultaneously. The good news is that the read_excel() method provides this feature for us. In order to do this, we can assign a list of sheet names or their indices to the sheet_name argument. But there is a much easier way to do the same: to assign None to the sheet_name argument. Let's try it:
all_sheets = pd.read_excel('sales_data.xlsx', sheet_name=None)Before exploring the data stored in the all_sheets variable, let's check its data type:
type(all_sheets)dictAs you can see, the variable is a dictionary. Now, let's reveal what is stored in this dictionary:
for key, value in all_sheets.items():
    print(key, type(value))
2020 <class 'pandas.core.frame.DataFrame'>
2021 <class 'pandas.core.frame.DataFrame'>The code above shows that the dictionary's keys are the Excel workbook sheet names, and its values are pandas DataFrames for each spreadsheet. To print out the content of the dictionary, we can use the following code:
for key, value in all_sheets.items():
    print(key)
display(value)2020| OrderDate | Region | Rep | Item | Units | Unit Cost | Total | Shipped | |
|---|---|---|---|---|---|---|---|---|
| 0 | 2020-01-06 | East | Jones | Pencil | 95 | 1.99 | 189.05 | True |
| 1 | 2020-02-09 | Central | Jardine | Pencil | 36 | 4.99 | 179.64 | True |
| 2 | 2020-03-15 | West | Sorvino | Pencil | 56 | 2.99 | 167.44 | True |
| 3 | 2020-04-01 | East | Jones | Binder | 60 | 4.99 | 299.40 | False |
| 4 | 2020-05-05 | Central | Jardine | Pencil | 90 | 4.99 | 449.10 | True |
| 5 | 2020-06-08 | East | Jones | Binder | 60 | 8.99 | 539.40 | True |
| 6 | 2020-07-12 | East | Howard | Binder | 29 | 1.99 | 57.71 | False |
| 7 | 2020-08-15 | East | Jones | Pencil | 35 | 4.99 | 174.65 | True |
| 8 | 2020-09-01 | Central | Smith | Desk | 32 | 125.00 | 250.00 | True |
| 9 | 2020-10-05 | Central | Morgan | Binder | 28 | 8.99 | 251.72 | True |
| 10 | 2020-11-08 | East | Mike | Pen | 15 | 19.99 | 299.85 | False |
| 11 | 2020-12-12 | Central | Smith | Pencil | 67 | 1.29 | 86.43 | False |
2021| OrderDate | Region | Rep | Item | Units | Unit Cost | Total | Shipped | |
|---|---|---|---|---|---|---|---|---|
| 0 | 2021-01-15 | Central | Gill | Binder | 46 | 8.99 | 413.54 | True |
| 1 | 2021-02-01 | Central | Smith | Binder | 87 | 15.00 | 1305.00 | True |
| 2 | 2021-03-07 | West | Sorvino | Binder | 27 | 19.99 | 139.93 | True |
| 3 | 2021-04-10 | Central | Andrews | Pencil | 66 | 1.99 | 131.34 | False |
| 4 | 2021-05-14 | Central | Gill | Pencil | 53 | 1.29 | 68.37 | False |
| 5 | 2021-06-17 | Central | Tom | Desk | 15 | 125.00 | 625.00 | True |
| 6 | 2021-07-04 | East | Jones | Pen Set | 62 | 4.99 | 309.38 | True |
| 7 | 2021-08-07 | Central | Tom | Pen Set | 42 | 23.95 | 1005.90 | True |
| 8 | 2021-09-10 | Central | Gill | Pencil | 47 | 1.29 | 9.03 | True |
| 9 | 2021-10-14 | West | Thompson | Binder | 57 | 19.99 | 1139.43 | False |
| 10 | 2021-11-17 | Central | Jardine | Binder | 11 | 4.99 | 54.89 | False |
| 11 | 2021-12-04 | Central | Jardine | Binder | 94 | 19.99 | 1879.06 | False |
Combining Multiple Excel Spreadsheets into a Single Pandas DataFrame
Having one DataFrame per sheet allows us to have different columns or content in different sheets.
But what if we prefer to store all the spreadsheets' data in a single DataFrame? In this tutorial, the workbook spreadsheets have the same columns, so we can combine them with the concat() method of pandas.
If you run the code below, you'll see that the two DataFrames stored in the dictionary are concatenated:
combined_df = pd.concat(all_sheets.values(), ignore_index=True)
display(combined_df)| OrderDate | Region | Rep | Item | Units | Unit Cost | Total | Shipped | |
|---|---|---|---|---|---|---|---|---|
| 0 | 2020-01-06 | East | Jones | Pencil | 95 | 1.99 | 189.05 | True |
| 1 | 2020-02-09 | Central | Jardine | Pencil | 36 | 4.99 | 179.64 | True |
| 2 | 2020-03-15 | West | Sorvino | Pencil | 56 | 2.99 | 167.44 | True |
| 3 | 2020-04-01 | East | Jones | Binder | 60 | 4.99 | 299.40 | False |
| 4 | 2020-05-05 | Central | Jardine | Pencil | 90 | 4.99 | 449.10 | True |
| 5 | 2020-06-08 | East | Jones | Binder | 60 | 8.99 | 539.40 | True |
| 6 | 2020-07-12 | East | Howard | Binder | 29 | 1.99 | 57.71 | False |
| 7 | 2020-08-15 | East | Jones | Pencil | 35 | 4.99 | 174.65 | True |
| 8 | 2020-09-01 | Central | Smith | Desk | 32 | 125.00 | 250.00 | True |
| 9 | 2020-10-05 | Central | Morgan | Binder | 28 | 8.99 | 251.72 | True |
| 10 | 2020-11-08 | East | Mike | Pen | 15 | 19.99 | 299.85 | False |
| 11 | 2020-12-12 | Central | Smith | Pencil | 67 | 1.29 | 86.43 | False |
| 12 | 2021-01-15 | Central | Gill | Binder | 46 | 8.99 | 413.54 | True |
| 13 | 2021-02-01 | Central | Smith | Binder | 87 | 15.00 | 1305.00 | True |
| 14 | 2021-03-07 | West | Sorvino | Binder | 27 | 19.99 | 139.93 | True |
| 15 | 2021-04-10 | Central | Andrews | Pencil | 66 | 1.99 | 131.34 | False |
| 16 | 2021-05-14 | Central | Gill | Pencil | 53 | 1.29 | 68.37 | False |
| 17 | 2021-06-17 | Central | Tom | Desk | 15 | 125.00 | 625.00 | True |
| 18 | 2021-07-04 | East | Jones | Pen Set | 62 | 4.99 | 309.38 | True |
| 19 | 2021-08-07 | Central | Tom | Pen Set | 42 | 23.95 | 1005.90 | True |
| 20 | 2021-09-10 | Central | Gill | Pencil | 47 | 1.29 | 9.03 | True |
| 21 | 2021-10-14 | West | Thompson | Binder | 57 | 19.99 | 1139.43 | False |
| 22 | 2021-11-17 | Central | Jardine | Binder | 11 | 4.99 | 54.89 | False |
| 23 | 2021-12-04 | Central | Jardine | Binder | 94 | 19.99 | 1879.06 | False |
Now the data stored in the combined_df DataFrame is ready for further processing or visualization. In the following piece of code, we're going to create a simple bar chart that shows the total sales amount made by each representative. Let's run it and see the output plot:
total_sales_amount = combined_df.groupby('Rep').Total.sum()
total_sales_amount.plot.bar(figsize=(10, 6))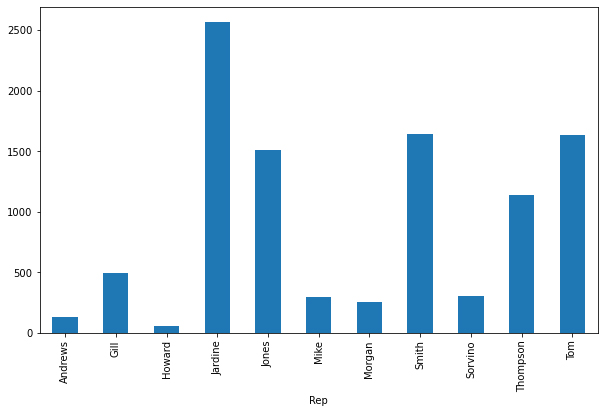
Reading Excel Files Using xlrd
Although importing data into a pandas DataFrame is much more common, another helpful package for reading Excel files in Python is xlrd. In this section, we're going to scratch the surface of how to read Excel spreadsheets using this package.
NOTE
The xlrd package doesn't support xlsx files due to a potential security vulnerability. So, we use the xls version of the sales data. You can download the xls version from the link below:
Sales Data Excel Workbook - xls ver.
Let's see how it works:
import xlrd
excel_workbook = xlrd.open_workbook('sales_data.xls')
Above, the first line imports the xlrd package, then the open_workbook method reads the sales_data.xls file.
We can also open an individual sheet containing the actual data. There are two ways to do so: opening a sheet by index or by name. Let's open the first sheet by index and the second one by name:
excel_worksheet_2020 = excel_workbook.sheet_by_index(0)
excel_worksheet_2021 = excel_workbook.sheet_by_name('2021')
Now, let's see how we can print a cell value. The xlrd package provides a method called cell_value() that takes in two arguments: the cell's row index and column index. Let's explore it:
print(excel_worksheet_2020.cell_value(1, 3))PencilWe can see that the cell_value function returned the value of the cell at row index 1 (the 2nd row) and column index 3 (the 4th column).
The xlrd package provides two helpful properties: nrows and ncols, returning the number of nonempty spreadsheet's rows and columns respectively:
print('Columns#:', excel_worksheet_2020.ncols)
print('Rows#:', excel_worksheet_2020.nrows)
Columns#: 8
Rows#: 13Knowing the number of nonempty rows and columns in a spreadsheet helps us with iterating over the data using nested for loops. This makes all the Excel sheet data accessible via the cell_value() method.
Conclusion
This tutorial discussed how to load Excel spreadsheets into pandas DataFrames, work with multiple Excel sheets, and combine them into a single pandas DataFrame. We also explored the main aspects of the xlrd package as one of the simplest tools for accessing the Excel spreadsheets data.